
.
May 8, 2013: A downloadable PDF of this article, including all graphs and tables, is now available here: M-F, 5.8.13 pdf
May 16, 2013: See also the related articles:
“Bruce Wallace’s ‘Creative Accounting’ (further critique of Monthly Review statistics)”
“Monthly Failure to Review: Even Worse than I Thought”
More Misused Wage Data from Monthly Review
The Overaccumulation of a Surplus of Errors
by Andrew Kliman, author of The Failure of Capitalist Production: Underlying Causes of the Great Recession
Introduction
The cover-story article in the March 2013 issue of Monthly Review is Fred Magdoff and John Bellamy Foster’s (2013) “Class War and Labor’s Declining Share.” They claim that that there has been “a long-term decline in the relative power of the working class, with capital increasingly gaining the upper hand,” and that this shift in power relations has produced a long-term “decline in the share of the economy going to labor.” The same claims were made in a 2008 article of theirs (Foster and Magdoff 2008). Although the new article does not mention the earlier one or my criticisms of its misuse of statistics (Kliman 2012, pp. 152–8), it seems to be an effort to defend Foster and Magdoff’s claims against these criticisms and perhaps against others that have been lodged.
More importantly, the new article seems to be an effort to defend their underconsumptionist theory of capitalist economic crisis. According to the “Monthly Review school,” crisis tendencies stemming from underconsumption are an ever-present feature of capitalism. As Foster and Robert W. McChesney (2012, pp. 33–4, emphases added) have recently written,
Capitalism, throughout its history, is characterized by an incessant drive to accumulate …. But this inevitably runs up against the relative deprivation of the underlying population …. Hence, the system is confronted with insufficient effective demand––with barriers to consumption leading eventually to barriers to investment.
“Labor’s declining share” is thus an integral part of their underconsumptionist theory of crisis. The decline in labor’s share, and the notion that class war is the cause of it, are also indispensable elements of Foster and Magdoff’s attempt to explain why the Great Recession occurred. Dispense with these elements, and one dispenses with their explanation. As they noted in their 2008 article, the “accelerated class war against workers to raise profits by pushing labor costs down” is a “key element in explaining” why the “financialized growth pattern” that began in the 1980s “was unable to produce rapid economic advance for any length of time, and was unsustainable.” Although “household consumption continued to rise[, this] was only possible because of … a constant ratcheting up of consumer debt” and more hours of work per household (Foster and Magdoff 2008).
In The Failure of Capitalist Production (Kliman 2012), I have put forward an alternative explanation of the underlying causes of the Great Recession, based on detailed analysis of official data as well as Karl Marx’s theory of capitalist crisis. Starting in the mid-1950s, U.S. corporations’ rate of profit fell and never recovered in a sustained manner under “neoliberalism.” This led to a slowdown in productive investment that in turn led to sluggish growth of output and income. (The growth of employee compensation slowed down because of this, not because of a redistribution from wages to profit.) Sluggish growth led to mounting debt burdens, as did government policies that repeatedly tried to manage or solve this complex of problems by throwing more debt at bad debt and encouraging a buildup of private-sector debt. The result was a series of worsening burst bubbles and debt crises, and ultimately the Great Recession.
The Failure of Capitalist Production also argues that the underconsumptionist theory of crisis is fatally flawed on logical grounds, which means that Foster and Magdoff’s explanation of the underlying causes of the Great Recession would be incorrect even if it happened to fit the facts (Kliman 2012, 160–80). This critique has gone unanswered.
Here, I intend to show that their new article provides no valid evidence in support of their class war/declining labor share thesis. Some of their key evidence––on employee compensation as a share of Gross Domestic Product (GDP), and on production and nonsupervisory (P&NS) workers’ share of total wages––is obtained by combining data from different datasets in a glaringly invalid way, without regard to whether the datasets are measuring the same thing. Some of their evidence is selective and tendentious, especially their evidence that real (inflation-adjusted) wages have fallen. The fall in real wages depends crucially on the use of an inconsistent “deflator” to adjust for inflation, and Magdoff and Foster fail or refuse to tell us what the growth rate of real wages is when some other widely-employed deflators are used. And even when their evidence that “labor’s share” declined isn’t technically incorrect, it is irrelevant.
The problem is that “labor’s share” is an ambiguous term; it can mean many different things. For instance, economists typically use it, and the term “capital’s share,” to refer to “returns” to the owners of different “factors of production” as shares of the output that has been produced. When Magdoff and Foster use these terms, however, they seem to mean something different––the shares of one or another measure of output or income that accrue, respectively, to “working-class” workers and to everyone and everything else (though it is unclear exactly what they are trying to measure, or why).
In light of this ambiguity, it should not be surprising that some data, even some data in Magdoff and Foster’s new article, do show that there has been a decline in things that can be called “labor’s share” in some sense. For instance, the income of the working class has fallen as a share of personal income, and compensation of employees has fallen as a share of GDP. And the data can been tweaked in other ways that produce downward-sloping curves. It is crucial to understand that this is not sufficient. By itself, a decline in some “labor share” does not count as evidence in favor of Magdoff and Foster’s class war/declining labor share thesis.
To count as evidence in its favor, what must decline is “labor’s share” in the specific sense required by the Monthly Review school’s underconsumptionist theory of crisis. According to that theory, the income of the working class declines as a share of the net output (or income) that is produced, which leads to a fall in personal consumption demand as a share of the net output. This in turn ultimately leads to a level of total demand that is insufficient to buy all of the net output, since the theory alleges that investment demand cannot increase enough, in the long run, to offset the relative decline in personal consumption demand.
Thus, to count as evidence in favor of this theory, the specific “labor share” that must have declined in the decades that preceded the Great Recession is the share of net output that the working class can buy with its income––i.e., without going more deeply into debt. Moreover, it must be plausible that the decline was caused by an acceleration of capital’s class war against the working class. As I will show, none of the evidence that Magdoff and Foster put forward satisfies either requirement, or even comes close.
The controversy over the underlying causes of the Great Recession has profound political implications. Marx’s theory of capitalist crisis has revolutionary implications, since it suggests that the crises result from the normal functioning of the system and are inevitable under it. In contrast, underconsumptionist theory lends itself to efforts to make capitalism work better. In the words of Paul Marlor Sweezy (1995, pp. 9–11), founding editor of Monthly Review and principal designer of the underconsumptionist theory sketched above,
If my analysis … is accepted, to what policy conclusions does it point? …
The second indispensable change needed to make the private-enterprise economy work better is a redistribution of wealth and income toward greater equality. We live in a period in which an unprecedented and growing share of the society’s income accrues to corporations and wealthy rentiers, while the share of the underlying population stagnates or declines. This implies a permanent imbalance between society’s potential for adding to its stock of capital and its flagging consuming power. … Would the capitalist class as a whole, in extremis, be willing to give up half of what it has to save the other half? I have a feeling that the fate of the private-enterprise system may depend on the answer to this question.
Because the key issue here is what caused the Great Recession, I will generally limit my examination of data to the period through 2007, at the end of which the recession erupted. Obviously, the sharp declines in wages and employees’ compensation (as shares of various things) that have since taken place are effects of the recession, not causes of it. These declines have greatly affected the well-being of tens of millions of people. It is important to emphasize this and to understand it more deeply. But a discussion of the underlying causes of the Great Recession is not the place to do so.
I realize that much of this article will conflict with the preconceptions of people who have heard a great deal about the alleged success of the “neoliberal” assault on the working class, the supposed decline in workers’ share of output, their stagnating “wages,” and so on, but less about research that challenges these notions. I plead with such readers to put their preconceptions aside and evaluate what Magdoff and Foster wrote, and what follows, on the basis of the evidence, the soundness with which the evidence is interpreted, and the cogency of the arguments. In a situation like this, it is wrong to dismiss evidence and arguments that conflict with what one already “knows” about this issue, or about the world in general, because what one “knows”––the question of whether it is actually correct or not––is precisely what is at issue.
The Employee-Compensation Shares of Gross and Net Output
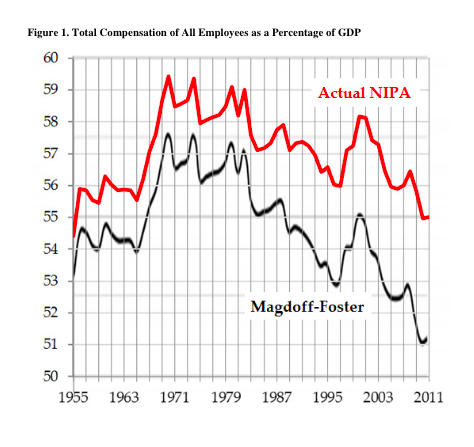
In support of their class war/declining labor share thesis, Magdoff and Foster tell us that compensation of employees fell as a share of U.S. GDP. Their Chart 1 indicates that it fell from about 57% to about 52.5% between 1982 and 2007.
However, the Magdoff-Foster employee-compensation share is seriously at variance with the one we get when we use the official compensation and GDP figures reported in the U.S. National Income and Product Accounts (NIPAs). Figure 1 superimposes the NIPA-based compensation share of GDP over the share that Magdoff and Foster presented in their Chart 1.[1] Note, first of all, that their compensation share is persistently lower. More importantly, it falls below the NIPA-based compensation share to a greater and greater extent as time proceeds. In 1955, the Magdoff-Foster figure was about 1 ½ percentage points less; by 2011, it was about 4 points less. Thus, between 1982 and 2007, the NIPA-based compensation share fell by about 3 percentage points, but the fall in the Foster-Magdoff share, about 4.5 points, was roughly 50% greater. In 2007, the NIPA-based compensation share exceeded its average value during the 1956–1965 period, while, the Magdoff-Foster figure was about 1 ½ to 2 percentage points lower in 2007 than it was between 1956 and 1965.
Figure 1. Total Compensation of All Employees as a Percentage of GDP
(Click here for a viewable PDF document containing all graphs and tables.)
How do they arrive at results that differ so greatly from those we get using official data? And why do they go to such great lengths to produce their variant results? What I mean by “such great lengths” is that the NIPA data on compensation of all employees are immediately and readily available. They are reported in NIPA Table 1.12, a table that Magdoff and Foster cite later in their article. But for some reason, they didn’t use these data. Instead, they indicate that they received unpublished data on compensation of private-sector employees from a different government bureau. Then, adding NIPA figures on the compensation of government employees to their unpublished private-sector figures, they obtained their alternative figures for the compensation of all employees.
Obviously, this procedure is invalid; it is tantamount to adding apples to oranges from which some sections have been removed. Since their alternative compensation figures are smaller––and increasingly smaller––than the official ones, it must be the case that some private-sector workers have been left out of their unpublished data, or that the unpublished data omit some components of employee compensation that the NIPA data include, or both. But Magdoff and Foster do not seem to be concerned about this glaring problem with their total compensation numbers, if indeed they are aware of it. They don’t explain why they chose not to use the official NIPA compensation data for all employees. They don’t even tell us that such data exist, much less that they yield quite different results.
Another key problem is that when one expresses compensation as a percentage of gross domestic product (as they do), one arrives at very misleading conclusions. In particular, this procedure is simply inappropriate in the context of a class-based analysis.
Consider the gross value added of the U.S. corporate sector, which is the GDP it produces. One part of it is the corporations’ labor cost, compensation of employees. Depreciation costs are another part. In order not to leave anything out of “profit,” let us use the term to refer to everything that’s left over. This third and final part of the gross value added is the income that accrues to the corporations before they pay interest expenses, various taxes, and fines and other minor items.[2]
Now, when we read that the compensation share of GDP has fallen, we are naturally driven to conclude that the profit share has risen. This is particularly true when we learn about the fall in the compensation share from Magdoff and Foster, who drive us relentlessly toward the conclusion that it fell because capital’s class war against labor has been a smashing success. It ain’t so. As Figure 2 shows, the compensation share of corporations’ gross value added did fall between 1955 and the Great Recession––but so did the profit share. Indeed, the profit share fell more steeply than did the compensation share.[3]
Figure 2. Compensation and Profit Shares of Corporations’ Gross Value Added
The reason why the shares accruing to both classes fell is that a sizable and growing share of GDP is not income that accrues to either class. It instead consists of the depreciation costs. Thus, if we want to express trends in the distribution of corporate-sector GDP in terms of “class analysis,” we have to say that the “depreciation class” has increasingly gained the upper hand, which has led to a long-term decline in the relative power of both the working class and the capitalist class. Depreciate, depreciate! That is Moses and the Prophets!
What happens when we set aside the victory of the depreciation class against labor and capital, and look just at the shares of the latter two classes vis-à-vis one another? In Figures 3 and 4, U.S. corporations’ compensation of employees and profit are expressed as shares of the corporations’ net value added (also known as net domestic product), that is, gross value added minus depreciation of fixed assets. Figure 3 shows that the compensation share increases while the profit share declines over the 1955–2007 period as a whole. Figure 4, which abstracts from the substantial rise in the compensation share at the expense of the profit share that took place during the second half of the 1960s, shows that the two shares fluctuated but did not trend upward or downward during the 37 years that preceded the Great Recession. Finally, Figure 5 shows that if we consider the entire business sector––corporations, partnerships, sole proprietorships, and tax-exempt cooperatives––there is once again no decline in employee compensation as a share of net value added.[4]
Figure 3. Compensation and Profit Shares of Corporations’ Net Value Added, 1955–2007
Figure 4. Compensation and Profit Shares of Corporations’ Net Value Added, 1970–2007
Figure 5. Compensation Share of Net Value Added, Corporate and Total Business Sectors, 1970–2007
To be sure, the working class and the capitalist class are at war. Even Time magazine has recently had to take notice of this ongoing class war. But there’s nothing new about it. It existed prior to the Great Recession. And contrary to Bill Moyers––whom Magdoff and Foster quote, apparently favorably––it existed before the early 1980s, Reaganism, the smashing of the PATCO union, “neoliberalism,” “financialized capitalism,” and all that. Thus, the question here is not whether capital has been engaged in class war. It is whether the capitalist class was smashingly successful in the conduct of that war in the decades leading up to the Great Recession.
Is it the case that “it was they who won,” as Moyers said (in the same quote), or that they “increasingly gain[ed] the upper hand,” as Magdoff and Foster claim? If a decline in the compensation share of business income or output is the measure of success, then clearly capital was not victorious and did not gain the upper hand. A luta continua.
Personal Income and the Working-Class Share of Net Output
Magdoff and Foster cite James K. Galbraith’s finding that the wage-and-salary share of personal income consistently declined from the 1950s to the end of the last century. They don’t tell us the significance of this fact, but they apparently want us to believe that the decline was caused by capital’s victories in the class war. And they apparently want us to believe, as well, that it indicates that the share of output that the U.S. working class can buy with its income—i.e. without going more deeply into debt—fell markedly over time, and that this latent underconsumption problem is a main source of the debt buildup that set the stage for the latest economic crisis, recession, and continuing malaise.
However, when we interpret the trends in personal income properly, we see that neither of these things is true. Property owners’ share of personal income did indeed rise markedly as a percentage of U.S. net output (Net Domestic Product) in the decades that preceded the Great Recession—but so did the working-class share! Both of them were able to rise because personal income, which is income that’s received by persons, rose more rapidly than net output, which is is the same thing as income that’s produced.
Personal income consists almost entirely of (1) compensation of employees (wages, salaries, and pension and medical benefits) and the portion of government social benefits that isn’t funded by taxes on employers, employees, and the self-employed,[5] and (2) dividends, interest income, rental income, and income of proprietors. In Figure 6, the items in (1) and (2) are called “working-class personal income” and “property owners’ personal income,” respectively, and both are expressed as percentages of Net Domestic Product.[6] These percentages are the shares of net output that the working-class income and property owners’ income can buy.[7]
Figure 6. Working-Class and Property Owners’ Personal Income (percentages of Net Domestic Product)
The working-class share of net output rose sharply between 1966 and 1970. After that point, it remained trendless on the whole, but trended upward to a moderate extent between 1984 and 2007. Property owners’ share rose sharply between 1979 and 1984, after which it trended upward, but not by as much as did the working-class share. Thus, the rise in property owners’ share of personal income did not come at the expense of the working class. Instead, what happened is that, from the start of the 1980s onward, companies paid out a larger share of their profits in the forms of interest income to their creditors and dividend payments to their shareholders; a smaller share of profit was used to fund productive investment and other expenditures.[8]
This means that the share of net output that the U.S. working class was able to buy—using only its income, not additional debt—did not decline in the decades that preceded the Great Recession. This fact disposes of the underconsumptionist explanation of the underlying causes of the recession. It is also incompatible with Magdoff and Foster’s class-pummel misinterpretation of the decline in the labor share of personal income.
Managers’ and Supervisors’ Share of Compensation
Magdoff and Foster argue that the decline in their labor share of GDP greatly understates the true extent by which working-class workers’ compensation has plummeted. “The wages and salaries (and benefits) of higher management positions have been rising in leaps and bounds in recent decades while workers’ wages at the bottom have lost ground.” Thus “the actual decline in wages as a share of GDP is much sharper where the working class itself is concerned.”
In an effort to support this claim, they use data for the wages of “production and nonsupervisory” (P&NS) workers in order to approximate the compensation received by the working class, and data for the wages of non-P&NS employees to approximate the compensation received by non-working-class employees. Their Chart 3 indicates that P&NS workers received only 55% of total private-sector wages in 2007, while non-P&NS employees received the remaining 45%.
However, the May 2007 Occupational Employment Statistics (OES), published by the U.S. Bureau of Labor Statistics, indicate that the combined wages of employees in management occupations and “first-line supervisors/managers” (employees whose primary duty is to directly supervise and coordinate the activities of other workers) were only 16% of total wages––less than three-eighths of Magdoff and Foster’s estimate of the share received by non-working-class employees. Thus, while Magdoff and Foster’s figures suggest that “the working class” received only 55% of total wages, the OES data indicate that workers other than managers and supervisors received 84%.
One reason why Magdoff and Foster produced such a gross underestimate of the share of wages received by “the working class” is that––once again––they mixed and matched different datasets with abandon. Their wages for private-sector P&NS workers come from the Current Employment Statistics (CES), while their total wage bill for all private-sector workers comes from the National Income and Product Accounts (NIPAs). The CES data indicate that P&NS workers received 67%, not 55%, of total wages in 2007, $2908 billion out of $4348 billion. But Magdoff and Foster ignored or overlooked this fact, and instead chose to express the P&NS figure as a percentage of the total NIPA wage bill, which was $5326 billion.[9] There is a huge difference between the two total wage bills, $978 billion. Magdoff and Foster improperly treat this $978 billion discrepancy between two datasets as if it were additional wages received by non-P&NS employees. This procedure artificially boosts their share of wages from 33% to 45% and artificially depresses P&NS workers’ share from 67% to 55% (see Figure 7). With equal justification––i.e., none––they could have treated the discrepancy between the CES and NIPA data as additional wages of P&NS workers, which would have brought their share of total wages to 73%.[10]
Figure 7. How to Turn 67% into 55%
Appendix 2 estimates the share of the discrepancy that can properly be allocated to management/supervisory employees, bending over backwards to refrain from underestimating their share. I estimate that no more than 37% to 45% of the discrepancy can be allocated to them and that their share of wages was between 16.4% and 20.6%.
Another reason why Magdoff and Foster seriously underestimate the working class’ share of wages is that the category of employees they exclude from the working class, non-P&NS employees, is far too broad. In 2007, 17.7% of private-sector workers were in that category, while the OES data indicate that only 9.2% of private-sector workers, barely half as many, were employed in management occupations or as first-line supervisors/managers.[11] To some extent, Magdoff and Foster are aware of the problem, noting that their category “undoubtedly includes many employees who might well be considered part of the working class.” But “many employees” is a serious understatement; they don’t seem to realize the huge extent to which they have undercounted the working class and its share of total wages.
One reason why the P&NS data fail to capture a large portion of the wages of non-management/supervisory employees is that the P&NS category excludes workers in goods-producing industries who aren’t directly engaged in “production” but who also aren’t managers or supervisors––for example, clerical workers in manufacturing and construction firms.[12] Even more importantly, the P&NS data also fail to capture the wages of millions of other workers, in both goods-producing and service-providing industries, because the P&NS category doesn’t make much sense to the people who answer the government’s survey questions. As the U.S. Department of Labor (2005) noted, “the production and non-supervisory worker hours and payroll data have become increasingly difficult to collect, because these categorizations are not meaningful to survey respondents. Many survey respondents report that it is not possible to tabulate their payroll records based on the production/non-supervisory definitions.”[13] Thus, such respondents either fail to provide the requested data or they ignore the official definition of P&NS workers and instead provide data on other, often narrower categories of workers (e.g., those covered by the Fair Labor Standards Act or paid on an hourly basis; see Abraham et al. (1998, pp. 311-3)).
As a result, the P&NS category greatly undercounts the number of working-class employees. This is one reason why Magdoff and Foster’s estimate of these employees’ share of total wages is far too low. Another reason is that the workers who should be counted, but aren’t (e.g., those not covered by the Fair Labor Standards Act or paid on an hourly basis) are undoubtedly the more highly-paid workers, at least on average. If wages of more highly-paid workers are rising faster than wages of low-paid workers––as has occurred in the U.S. in recent decades––then, as time proceeds, data that wrongly exclude more highly-paid workers will understate the working class’ share of total wages to a greater and greater extent.
This is one reason, perhaps the main reason, why Magdoff and Foster find that the working class’ share of wages has fallen precipitously. It should also be noted that, since P&NS data are not based, in practice, on a standard definition––firms seem frequently to employ their “own” definitions and the firms included in the survey change over time––and since failure to respond to questions about P&NS workers has been a significant problem, reported trends in the wages and hours of these workers are questionable.
The Share of Disguised Profit in the Wage Data
Magdoff and Foster note that employee compensation data include “the compensation going to CEOs and other upper-level management, which ought to be counted as income to capital rather than labor … [, and which has] been rising by leaps and bounds in recent decades.” To obtain a presumably better measure of the compensation that legitimately counts as labor income, they use the wages of P&NS workers. But the P&NS figures are woefully inappropriate in this context.
Part of the problem is the one discussed above––the exclusion of a large and relatively highly-paid segment of the working class from the P&NS data. But even a proper estimate of the share of wages actually received by management/supervisory employees––16% of the total in 2007, according to OES data, not 45%––vastly overstates the share of employees’ compensation that is actually “income to capital” rather than genuine “labor income,” i.e., profit in disguise. According to Magdoff and Foster themselves, the disguised profit includes only “the compensation going to CEOs and other upper-level management” (emphasis added), not the total pay of all management/supervisory employees. Compensation received by first-line supervisors and most management employees is legitimately part of “labor’s share,” even if these employees are not members of “the working class” in some other sense of that term.
The 2007 OES data indicate that the average annual wage rate of first-line supervisors/managers was $47,370, just 16% more than the overall average wage ($40,690). These data also indicate that three-fourths of those in management occupations received an annual wage of $121,690 or less, which means that their wages were less than triple the overall average. It would be unreasonable to count the wages of these two groups of employees as disguised profit or capital income. Moreover, even the wages received by a large segment of “chief executives” seem to be payment for the labor services they perform rather than profit in disguise; 25% of them received wages less than or equal to $97,960, which is 2.4 times the overall average wage.
Thus, if we wish to estimate the share of wages or compensation that is actually “capital income” or disguised profit, it seems advisable to base the estimate on wage levels rather than on specific occupational categories like “chief executive” or “CEO.” And it seems advisable to include, as recipients of profit disguised as wages, only the small percentage of management employees who were paid well in excess of triple the average wage. I chose to include the most highly-paid 10% of employees in management occupations.[14]
The OES dataset lacks data on very high wages, but I was able to use reported data to estimate wages of the top 10% of management employees (see Appendix 3 for details). My estimates indicate that, to be in this group, a manager needed an annual wage of at least $171,680, which was 4.2 times the overall average wage and which probably placed him or her in the top 2% or 3% of all wage earners, but not the top 1%.[15] The top 10% of management employees received 23.34% of the total wages received by those in management occupations, or 2.46% of the total wages received by all employees. Since the top 10% of managers were 0.45% of all employees, their average wage was 2.46%/0.45% = 5.5 times the overall average wage.
Now, Magdoff and Foster’s Chart 3 indicates that the share of wages received by P&NS workers fell by 21 percentage points between 1965 and 2007, from 76% to 55%, which means that the share of wages received by “management, supervisory, and other nonproduction employees” almost doubled, rising from 24% to 45%. They suggest that this tells us something meaningful about the fall in the share of wages that is genuinely “labor income” and the rise in the share that represents “capital income” or disguised profit. My results––based on what I think is a clearly better measure of “upper-level management,” and thus a clearly better measure of the amount of profit that is disguised as wages––indicate that Magdoff and Foster’s estimates are wildly off the mark. Since the top 10% of management employees received 2.46% of total wages in 2007, their share of total wages could not have risen by more than 2.46 percentage points between 1965 and 2007. Thus, other employees’ wage share could not have fallen by more than 2.46 percentage points, which is less than one-eighth of the decline that Magdoff and Foster report for P&NS workers.
The OES data extend only as far back as 1997, so it is impossible to use them to directly estimate long-term trends. But backward simulation using the 2007 data is informative. As I have noted, my estimates indicate that the maximum possible rise in the share of wages received by the top 10% of management employees was 2.46 percentage points. But their share could have risen by that much only if, in Marx’s famous phrase, they “lived on air” back in 1965, which was not the case. If they were paid no more than the average worker in 1965, then their share of wages rose by 2.02 percentage points, and if their average wage were originally double the overall average wage, then their share rose by 1.57 points (see Table 1).[16] But these cases also seem to be quite unlikely. The average wage of all management employees might well have been no more than double the overall average wage, but it is hard to believe that the top 10% of them were paid so little.
Table 1. Simulated Changes in Shares of Wages and Output, Top 10% of Managers
It is much more likely that their average wage was originally as least triple the overall average, which implies that their share of total wages rose by no more than 1.12 percentage points. And this, in turn, implies that any rise in their wage share that may have occurred led to a fall in other employees’ share of output (net value added) of less than 0.7 percentage points between 1965 and 2007. This is one-fifteenth of the 10.3 percentage-point fall in P&NS workers’ wages as a share of GDP that Magdoff and Foster report.
Wage and Compensation Growth
Obviously, employers’ labor costs include the nonwage compensation (such as pension and medical benefits) that their employees receive, as well as wages and salaries. Thus, when Foster and Magdoff (2008) pointed to the “sharp decline in the share of wages and salaries in GDP between the late 1960s and the present” as if it were proof that capital had emerged victorious in its “accelerated class war against workers to raise profits by pushing labor costs down” (emphases added), they in fact provided no support for this claim at all. As we saw above, labor costs––total compensation––did not trend downward as a share of business-sector net value added between 1970 and 2007, and the fall in the compensation share of Gross Domestic Product testifies to the victories of the “depreciation class,” not the capitalist class.
Yet in their new article, Magdoff and Foster once again try to draw conclusions about the state of the class war from wage and salary data. They claim that “[i]n all cases, … the general trends” in workers’ total compensation “are very similar” to the trends in their wages and salaries alone. And on the basis of this supposed fact, they conclude “‘that analyses … that focus on wage trends’ alone as opposed to total compensation ‘are using an appropriate proxy for compensation, at least on average.’”
However, the phrases they quote here, from the 2012 edition of the Economic Policy Institute’s The State of Working America, are out of context and egregiously distort the meaning of the original document. What that document says is:
Measured over the long term, benefits have become a more important part of the average worker’s total compensation package. In 1948 payroll taxes [paid by employers’ on employees’ behalf] and health and pension programs made up only 5.1% of compensation. By 1989 the share had risen to 18.6%. But the benefit share of compensation has remained largely flat since 1987 … the growth of total compensation has largely paralleled that of wages over the last 20 or 30 years. … One implication of compensation and wages growing roughly in tandem is that analyses (such as the one below) that focus on wage trends are using an appropriate proxy for compensation, at least on average. [Mishel et al. 2012, p. 182, emphases added]
Thus, the general trends in workers’ compensation have not been very similar to the trends in their wages and salaries “[i]n all cases.” “[O]ver the long term,” benefits—nonwage components of compensation—have increased far more rapidly than have wages and salaries, which implies that total compensation has increased more rapidly as well. It is only “over the last 20 or 30 years” that “the growth of total compensation has largely paralleled that of wages.”
Thus, it is only “over the last 20 or 30 years” that “wage trends are … an appropriate proxy for compensation [trends], at least on average.” For the period before the mid-1980s, when wages were falling markedly as a share of compensation (see Figure 8), figures for wage growth greatly underestimate the growth of the total compensation that workers received.[17] Between 1955 and 1984, for example, the wage-and-salary share of U.S. Net Domestic Product fell by 6.5% (from 57.1% to 53.4%), but the total compensation share rose by 7.0% (from 60.7% to 65.0%).[18] Yet Magdoff and Foster use wages as a proxy for compensation during the entire period since 1955. They thus draw conclusions––and graphs––that are extremely misleading (though the graphs are, I must admit, really scary-looking).
Figure 8. Wages and Salaries as a Percentage of Total Compensation, Total U.S. Economy
I urge readers not to be misled. The decline in the wage-and-salary share of GDP is simply not evidence of capital’s success in the class war. To the extent that the decline is not due to the success of the “depreciation class,” it represents the victory of the “nonwage compensation working class” over the “wage and salary working class” (whatever that might mean) rather than the victory of the capitalist class over the working class.
According to Magdoff and Foster, “since the early 1970s … the real hourly wage for all nonfarm private workers has declined, [and] weekly (or annual) wages and salaries have fallen even faster.” One problem with this statement is that it is meant to tell us something meaningful about real total compensation, but changes in wage rates through the mid-1980s are not legitimate proxies for changes in total compensation. Another problem is that it is simply incorrect to refer to “all” nonfarm private workers; Magdoff and Foster’s data are for P&NS workers only. But perhaps the biggest problem is that, as I noted in The Failure of Capitalist Production (Kliman 2012, pp. 155–6) in reference to their 2008 article, “there are different ways of adjusting for inflation. The method they chose makes the growth in real pay seem smaller. … Foster and Magdoff should have informed readers of the different methods of inflation adjustment and the different results to which they lead.”
Their practice has not improved. They have once again chosen the method of adjusting for inflation that minimizes wage growth. And they have once again failed to inform their readers that different methods exists or to report on the different results they would have obtained if they had used a different method.
Magdoff and Foster use the Consumer Price Index for Urban Wage Earners and Clerical Workers (CPI-W). It is falling into disuse, because it is an inconsistent series––when the methods used to compute new values of the index change, past values are left unrevised. The Consumer Price Index Research Series Using Current Methods (CPI-U-RS), which overcomes this problem, is increasingly used instead. Many experts contend that both of these indexes overestimate inflation (and thus underestimate real wage growth), and prefer the personal consumption expenditures price index (PCEPI).[19]
Let us use each of these, and consider how different methods of adjustment for inflation affect the results for the period between 1987 and 2007––i.e., from the first year in which wages were an appropriate proxy for total compensation (according to the Economic Policy Institute) to the start of the Great Recession. Even if we use the CPI-W to adjust for inflation, we find that P&NS workers’ real average weekly earnings did not fall. They rose by 3.2%. If we use the CPI-U-RS, we find that they rose by double that amount, 6.5%. And if we use the PCEPI, we find that they rose by 12.1%, almost four times as much. P&NS workers’ real average hourly earnings grew even faster, by 5.9% when we use the CPI-W to adjust for inflation, 9.3% when we use the CPI-U-RS, and 15.1% when we use the PCEPI.[20]
Thus, during the period in which wages were an acceptable proxy for total compensation, no decline in real wages occurred. Nor can they be said to have stagnated, unless we ignore the results we get when we use the CPI-U-RS and PCEPI as well as the growth of hourly earnings.
It is important to reiterate that these figures are for P&NS workers rather than all workers, and that the P&NS data undercount the better-paid non-management/supervisory workers. In a period in which increasing wage inequality seems to have made the workers included in the P&NS count increasingly unrepresentative, this appears to be a significant problem. It should also be noted that there are different definitions of wages or earnings, and the one used here is among the narrowest.
The Importance of Benefits, Especially Social Security
I noted above that Magdoff and Foster justify their focus on wages rather than total compensation by claiming, incorrectly, that the former is an acceptable proxy for the latter “[i]n all cases.” They also give us an additional, utilitarian, justification:
[Some benefits that workers receive as compensation] are genuine social insurance programs[, but others], such as the Health Management Organizations (HMOs) in which workers are enrolled by their employers, are private insurance programs, where workers are required to pay a large and increasing portion of the cost, generating high profits to insurance companies and offering diminishing use-value [utility] per benefit dollar to employees.
Wages and salaries, as distinct from total compensation, are especially important for workers at the lower-income levels, since this is the basis of their everyday consumption, constituting their means of subsistence.
Yet the fact that providers of medical insurance generate high profits is irrelevant in this context. It does not mean that the medical benefits are “really” profits rather than legitimate employee compensation. If they were really profits, then cash wages would really be profits as well, since cash wages used to buy iPhones and all manner of necessities at Wal-Mart generate high profits for Apple and the Walton family. The key point is that workers’ receipt of income is one thing; their subsequent exchange of that income for goods and services is another. The former reduces capitalists’ profits; the latter is an exchange of equal sums of value––for instance, the exchange of $100 for a $100 iPhone or $100 worth of a physician’s services.
In the context of Magdoff and Foster’s discussion of the distribution of income between classes and capital’s supposed success in the class war, their utilitarianism is also irrelevant. One aim of capitalists is to lower labor costs in order to get more profit. Reducing the utility of their workers, in contrast, is not among their aims and not a measure of their success. A company’s labor costs increase by $1, and its profit is consequently $1 less, if it pays its workers $1 more. This is true whether the workers receive the dollar in the form of cash or whether they receive it in the form of benefits. And it is true whether they receive a lot of utility or whether they receive little utility from the goods and services that the extra dollar buys.[21]
The final sentence I quoted suggests that nonwage benefits are not part of lower-income workers’ “everyday consumption” or “means of subsistence.” It is astonishingly false. What about all the prescription drugs they consume, often every day, which are paid for, partly or wholly, with medical insurance benefits? And what about the Social Security checks that are the basis of lower-income retired workers’ everyday consumption, i.e., the main source of the income with which they purchase means of subsistence?
This is far from a quibble. If we want to understand why the compensation that workers receive has not stagnated, it is crucial to focus on the rapid growth of pension and medical benefits, especially Social Security benefits received by retired workers.
During the 1960s, the poverty rate was far, far higher among people 65 years old and over than among the rest of the U.S. population (see Figure 9).[22] But the gap then began to close rapidly, and by 1982, it disappeared. After that point, the poverty rate among seniors continued to fall, even during the Great Recession and its aftermath, in striking contrast to trends in the poverty rate of everyone else. Three in ten U.S. seniors lived in poverty as recently as 1967, but fewer than one in ten does so today. What has been driving this trend is phenomenal growth of seniors’ incomes. As Figure 10 shows, the real (i.e., inflation-adjusted) money income of the median senior-headed household rose by 99% between 1967 and 2010.[23] Overall median income rose by only 21%, barely one-fifth as fast. And the rapid growth of seniors’ income, like the sharp fall in their poverty rate, contrasts strikingly with what has taken place among other age cohorts, especially the youngest ones.
Figure 9. Poverty Rates of People by Age
Figure 10. Real Median Household Income, by Age of Householder, 1967–2010
Since Figure 10 pertains to median (middle) incomes, the seniors’ income is not being pulled up by a relatively small percentage of wealthy seniors who live off of income from securities, lavish severance packages, and the like. And since the Census Bureau’s definition of “money income” excludes Medicare, Medicaid and other income received in kind, the growth of seniors’ money income depicted in Figure 10 has nothing to do with medical-service inflation. What has caused this remarkable growth? As Figure 11 shows, the real average monthly Social Security benefit received by retirees increased by 145% between 1960 and 2010, and by 105% between 1970 and 2010, when the PCEPI is used to adjust for inflation.[24] When a combination of the CPI-U and the CPI-U-RS series are used, the growth is almost as striking, 116% between 1960 and 2010, and 87% between 1970 and 2010. [25] Both methods lead to the conclusion that the growth in seniors’ real median money income between 1967 and 2010 was quite close to the growth of the real average Social Security benefit over that period. This strongly suggests that increases in Social Security benefits are the main cause of the phenomenal rise in seniors’ income and the sharp decline in their poverty rate.
Figure 11. Retired Workers’ Real Average Monthly Social Security Benefit
It is all too easy to overlook these crucial facts. This is undoubtedly a major reason why accounts, such as Foster and Magdoff’s, which very misleadingly tell us that real “wages” have stagnated, resonate among many people despite their tenuous relationship to reality. If you are relatively young and healthy, it is easy to forget about Social Security benefits, and about Medicare benefits and employer-provided pension and medical benefits, which you will consume––every day––when you retire. And it may be easy for some people to forget about their retired parents or grandparents when they say that their family is worse off than it was a generation or two ago.
Ignorance is undoubtedly also a major factor. How many people know, for instance, that three in ten seniors lived below the poverty line as recently as 1967? And how many know that employers pay for half of employees’ Social Security and Medicare benefits, and that the government is kicking in a substantial amount of extra money on top of that to fund Medicare? If one doesn’t know this, it’s easy to think that Social Security and Medicare benefits are just deferred wage-and-salary income funded solely by payroll taxes on workers, rather than additional compensation over and above wages and salaries.
In sum, various factors make it easy to focus just on the portion of your compensation that you receive right now. Might Magdoff and Foster be playing to such myopia when they suggest that wages and salaries alone are the basis of low-income workers’ “everyday consumption”? This shockingly false statement comes much closer to the truth if one translates “everyday” as immediate, as opposed to lifetime. But in that case the statement also reinforces gross misunderstandings and encourages people to think about issues of compensation in a hopelessly short-sighted and naïve way.
Opponents of the Social Security system have long wanted to dismantle it. To date, they have completely failed. Nor have they––yet––forced workers to pay for a greater share of their benefits or slowed down cost-of-living increases in Social Security payments. And the phased-in rise in the eligibility age from 65 to 67 pales in comparison with the rise in life expectancy: the average retiree receives more, not fewer, years of Social Security income. Moreover, she receives far more of it each year than her parents and grandparents did, as we have seen. This is a clear sign that something is seriously wrong with the notion that capital’s war against the working class was smashingly successful in the decades leading up to the Great Recession.
Increased Differentiation Within the Working Class
Magdoff and Foster’s treatment of the compensation and income of the working class fails to give due attention to disparate trends among different groups of workers. The more one does attend to these disparate trends, the more the notion that capital’s victories in the class war have led to “labor’s declining share” breaks down.
Consider the strong increase in seniors’ income once again. If capital has become so increasingly powerful, how have seniors managed to achieve such gains––and hold onto them, even in the midst of the Great Recession and its aftermath? Is the accelerated class war being waged only against younger workers?
Or consider women. Magdoff and Foster have not a word to say about their wages. Is this due to sexism? I doubt it. I suspect, instead, that they chose to ignore the strong growth of women’s wages because it does not fit in well with the class war/declining labor share thesis. As Figure 12 shows, the real “median usual weekly earnings” of women employed full-time rose by 22% between 1979 and 2007, even if we use the CPI-W to adjust for inflation. They rose by 27% if we use the CPI-U-RS and by 35% if we use the PCEPI.[26] How was this possible? Is the accelerated class war being waged only against male workers?
Figure 12. Women’s Real Median Usual Weekly Earnings
Or consider Figure 13, which is based on a Congressional Budget Office (2011) study that reported on trends in real median hourly wages among workers with different levels of educational attainment.[27] It shows that there was substantial wage growth among women with at least some college education and among men with at least a 4-year college degree. How can the class war/declining labor share thesis explain this?
Figure 13. Real Median Hourly Wage Growth, by Sex and Educational Attainment, 1979-2009
What we are left with is this. If wage trends can be adequately explained on the basis of a smashingly successful acceleration of the class war, it must be a class war only against younger, male, and less-educated workers, not a class war against older, female, and better-educated workers. But then it isn’t a class war. The alternative is that a class war is indeed being waged against the whole working class, but it wasn’t very successful, at least not insofar as wages and compensation are concerned, in the decades that preceded the Great Recession. Take your pick.
The increasingly precarious situation of younger male workers who aren’t college educated is a very serious problem. The causes of it, and the causes of other aspects of increased inequality within the working class, are not fully understood. There remains a lot left to explain. But one thing is clear: the notion that capital has been waging a smashingly successful war against the whole working class cannot explain the substantial growth in the incomes of older, female, and more highly-educated working people.
In Lieu of a Conclusion
James K. Galbraith is director of the University of Texas Inequality Project. Because Magdoff and Foster cite an early study of his in support of their claim that labor’s share has been declining for a long time, and because Galbraith recently had some important and thought-provoking things to say about the matter, I give him the last word:
I think there is a tendency on the left … to focus on some statistical aspects of what’s happened to wages—median wages in particular—and to focus less on the role played by Medicaid, Medicare, Social Security, the housing programs, public education, and support for higher education, all of which gave us a population that had the attributes of a middle class society.
The story that is often told about what’s happened to factory jobs, and what’s happened to wage rates, is not a good way of getting at the threat to that existence. The typical story is that median wages peaked in 1972 and have been stagnant and falling since then. As a result, it must be the case that people who are working now are much worse off than they were ten, fifteen, twenty years ago. That’s not an accurate story—at least not up until the crisis in 2008—because over that period the labor force became younger, more female, more minority, and more immigrant. All of these groups start at relatively low wages, and they all then tend to have upward trajectories. So there’s no reason to believe that life was getting worse for members of the workforce in general. On the contrary, for most members of the workforce it was still getting better. …
The real threat to the middle class is not there, it’s in the erosion of the programs I just mentioned. …
So I think there is a threat to the middle class, but if I were talking about it in political terms, I wouldn’t be giving an abstract statistical picture of wages. This doesn’t connect to people’s experiences. If I were designing the boilerplate rhetoric of a popular movement, I would take a blue pencil to these statistical formulations. I don’t like the stagnant median wage argument—I think it obscures what actually happened. And I don’t particularly care for the “one percent” argument. I understand it has a certain power, but one can be much more precise about what it is you want to attack, and what it is you want to preserve and to build. [Galbraith 2013]
Appendix 1: URLs of Main Data Sources
Bureau of Economic Analysis’s Fixed Asset tables: www.bea.gov/iTable/index_FA.cfm
Current Employment Statistics (CES), Bureau of Labor Statistics: www.bls.gov/ces/
National Income and Product Accounts (NIPAs), Bureau of Economic Analysis: www.bea.gov/iTable/index_nipa.cfm
Occupational Employment Statistics (OES), Bureau of Labor Statistics: www.bls.gov/oes/home.htm
Quarterly Census of Employment and Wages (QCEW), Bureau of Labor Statistics: www.bls.gov/cew/
Appendix 2: P&NS Workers’ CES Wages and Total NIPA Wages: Accounting for the Gap
As I noted above, the reason why Magdoff and Foster conclude that P&NS workers received only 55% of total wages in 2007 is that they mixed and matched CES and NIPA data with abandon, without providing any justification and apparently unthinkingly. In contrast, Mohun (2013) is aware of the difference between the two datasets’ total wages, and he recognizes that the wages “missing” from the CES but present in the NIPA data need to be allocated between P&NS and other workers in a careful manner. Yet, after what indeed seems to be a careful and thoughtful consideration of the problem, he likewise assigns 100% of the missing wages to non-P&NS workers! Mohun justifies his procedure as follows:
[it] accounts for stock options, bonuses, retroactive pay and the like, … for these sorts of payments typically do not accrue to the working class. It is less reasonable to make such an allocation for irregular tips, free rent, fuel, meals, and other payment in kind. … It is evidently a major assumption to allocate all of the missing CES wages to supervisory workers, but it does not seem an unreasonable approximation.
Let us see just how reasonable it is. What share of the missing wages can properly be allocated to workers who aren’t management/supervisory employees? And once the missing wages have been properly allocated, what percentage of total wages do the non-management/supervisory employees receive? Is the 55% figure that Magdoff and Foster arrive at, or the similar figure that Mohun reports, in fact a reasonable approximation?
To account properly for the missing wages, we have to move step-by-step between different datasets. The P&NS wage data come from the Current Employment Statistics (CES) program. However, data from the Occupational Employment Statistics (OES) program allow us to account much more accurately for the number of workers who aren’t management or supervisory employees; a good deal of the missing wages of non-management/supervisory workers will be picked up in that move. Next, by moving between the OES data and those from the Quarterly Census of Employment and Wages (QCEW), we pick up many components of wages that the OES survey misses because it defines wages narrowly. Finally, by moving between QCEW wages and wages as reported in the National Income and Product Accounts (NIPAs), we pick up wages that are missing from the QCEW––unreported and underreported wages, and wages not counted due to the QCEW’s exclusion of industries and workers that aren’t covered by the unemployment insurance system.
Move from CES to OES. It is desirable to be as comprehensive as possible when assessing the share of wages received by non-management/supervisory employees. Total-economy wage data are reported in all of the series considered here except for the CES, which excludes government and farm workers. To obtain CES-like wage figures comparable to those in the other series, I “marked up” the CES wages of P&NS and other workers by the percentage by which total-economy wages exceed private nonfarm wages.[28] After CES wages are adjusted in this manner, total OES wages remain 3.9% higher than total CES wages. I therefore increased the wages of all workers by that percentage. This adjustment accounts for 7.2% of the total gap between the CES wages of P&NS workers and total NIPA wages, 4.8 percentage points of which accrue to non-management/supervisory workers and the rest of which accrue to management/supervisory employees (see Table 2).[29]
Table 2. Allocation of Gap Between P&NS Workers’ CES (Total-Economy) Wages and Total NIPA Wages, 2007
Even after the above adjustments are made, the wages of non-management/supervisory workers reported in the OES exceed the wages of P&NS workers reported in the CES by more than 25%. This is because the P&NS data undercount non-management/supervisory workers, by excluding those in goods-producing industries who aren’t “production” workers and by missing millions more of them (especially more highly-paid workers) throughout the economy, for other reasons. CES data indicate that P&NS workers were only 82% of all employees, while OES data indicate that non-management/supervisory workers were 91% of all employees.[30] This undercount explains 32% of the gap between the CES wages of P&NS workers and total NIPA wages.
Move from OES to QCEW. In 2007, QCEW wages exceeded OES wages by 11%. A small part of the difference is attributable to the fact that QCEW employment was 0.75% greater than OES employment. I therefore increased the wages of all workers by that percentage. This adjustment accounts for only 1.4% of the gap between P&NS wages and NIPA wages; 1.2 percentage points of it accrue to non-management/supervisory workers.
The remainder of the gap between QCEW wages and OES wages is evidently attributable to the fact that wages as defined in the QCEW include many items that OES wages exclude. The QCEW does not provide data on specific wage components, but it proved possible to identify some, though not all, of these items separately and to adjust the wages of the two groups of workers accordingly.
First, quarterly Employer Cost for Employee Compensation (ECEC) data for civilian workers in 2007 indicate that employees in “management, business, and financial operations” occupations received “supplemental pay”––bonuses, overtime pay, and shift-differential pay––equal to 5.18% of their pre-supplement wages and salaries (the definition of which is similar to the OES definition). The corresponding figure for all workers was 3.67%.[31] To obtain a somewhat rough estimate of post-supplement wages, I increased the wages of management/supervisory employees, and of all workers, by these percentages. (As a result, wages of non-management/supervisory workers were increased by 3.37%). These adjustments account for 7% of the gap between P&NS wages and NIPA wages; 5.4 percentage points of it accrue to non-management/supervisory workers.[32] Second, QCEW wages include income from exercised stock options and “golden parachutes.” I assumed that management/supervisory employees received all of this income. This adjustment accounts for 1.9% of the gap between P&NS wages and NIPA wages.[33]
The adjustments outlined above account for slightly more than half of the difference between QCEW wages and OES wages. There remains a difference of $252.1 billion, an amount equal to 8.7% of the gap between P&NS workers’ wages and total NIPA wages. This sum of money includes commissions, a portion of employers’ contributions to employees’ 401(k) pension funds, tips, other severance pay, back pay/deferred pay, jury duty pay, and tuition reimbursements. It did not prove possible to estimate the individual dollar amounts of these items. As a result, they could not be safely allocated between management/supervisory employees and other workers.
Move from QCEW to NIPA. NIPA wages exceed QCEW wages partly because the former include wages of workers in industries that are not covered or not fully covered by the unemployment insurance system, and partly because the NIPAs adjust for underreported tips and for wages paid by employers who underreported wage payments or failed to file an unemployment insurance report. A very small adjustment is also made to account for the difference between disbursed and accrued wages. I assumed that these adjustments do not alter the shares of wages received by management/supervisory employees and other workers (or affect the relative size of unallocated wages), and allocated the difference between NIPA wages and QCEW wages accordingly. This accounts for 13.7% of the gap between P&NS workers’ wages and total NIPA wages, 10.9 percentage points of which accrue to non-management/supervisory workers.[34] (Mohun (2013) discusses the NIPA adjustments, but does not explain why he allocated all of the wages of workers not covered by unemployment insurance to non-P&NS workers. As for the other NIPA adjustments, his stated justification for allocating all of them to non-P&NS workers is that the sum of money involved is relatively small.)
After all adjustments have been made, only 36.4% of the gap between P&NS wages and total NIPA wages consists of the (NIPA) wages of management/supervisory employees. And even if we were to allocate to them the entire unallocated portion of the gap between QCEW wages and OES wages, only 45.7% of the total gap would consist of their wages. The remainder of the gap, 54.3% to 63.6% of the total original gap, consists of wages of non-management/supervisory workers that CES data fail to capture. This is a far cry from the 0% share that Magdoff-Foster and Mohun assign to them!
Once the missing wages of non-management/supervisory workers are added back in, their share of NIPA wages increases from 54.9% to 81.5% + 2.1% , depending on the amount of the unallocated gap that can be assigned to them. Accordingly, management/supervisory workers’ share declines from 45.1% to 18.5% + 2.1%. Elimination of the CES’s undercount of non-management/supervisory workers is the largest source of the increase in their share of NIPA wages. It accounts for almost a third of the total gap. The additional wages they receive as we move from the CES definition of wages to the NIPA definition are also significant. They account for almost one-sixth of the gap.
In Table 3, I allocate half of the unallocated gap to each group of workers, not as an approximation, but in order to be able to compare my results to those of Magdoff-Foster and Mohun. When the missing wages are properly allocated, total wages of non-management/supervisory workers are about one-third higher than the total that results from Magdoff-Foster and Mohun’s procedures, and the total wages of management/supervisory employees are about only about two-fifths as great. Thus, while the procedures of Magdoff-Foster and Mohun would lead us to believe that management/supervisory employees’ wages were, on average, 3.8 times that of other workers, the more careful accounting presented above indicates that they were only about 2.2 times as great.
Table 3. Comparison of Magdoff-Foster/Mohun and Revised Wage Distributions
Appendix 3: Estimating the Wages of the Top 10% of Management Employees
To estimate the portion of management employees’ wages that were received by the top 10% of them, I estimated the portion received by the bottom 90% and subtracted it from management employees’ total wages. I used 2007 OES wage figures for management employees at the 10th, 25th, 50th, and 75th percentiles to estimate the share received by the bottom 90%, fitting a lognormal cumulative distribution function to these data. I chose a lognormal function because the incomes of all but the very highest-income people have generally been found to be distributed approximately lognormally. The median wage of management employees served as the mean of the lognormal distribution, and I chose the standard deviation that resulted in the smallest sum of squared differences between the reported and estimated percentiles of management employees whose wages were less than or equal to the reported wages at the 10th, 25th, 50th, and 75th percentiles. The estimated cumulative distribution function fits the data extremely well, as Figure 14 shows. The estimated frequency distribution of the bottom 90% of management employees’ wages is shown in Figure 15.
By selecting a lognormal distribution, I assumed in effect that the logarithms of management employees’ wages are distributed normally, i.e., in bell-curve fashion. Selection of the median wage as the mean of the estimated distribution guarantees that half of the managers received less, and half received more, than the median wage, just as in the actual distribution. Selection of the standard deviation of management employees’ wages specifies how widely or narrowly spread out they were. The standard deviation I chose implies that the middle 68.3% of them received between $48,538 and $146,897.
Figure 14. Cumulative Wage Distribution, Bottom 90% of Management Employees, 2007
Figure 15. Probability Density Function, Wages of Bottom 90% of Management Employees, 2007
References
Abraham, Katharine G., James R. Spletzer, and Jay C. Stewart. 1998. “Divergent Trends in Alternative Wage Series.” In John Haltiwanger, Marilyn E. Manser, and Robert Topel (eds.), Labor Statistics Measurement Issues. Chicago: University of Chicago Press.
Abraham, Katharine G. and James R. Spletzer. 2009. “New Evidence on the Returns to Job Skills,” American Economic Review 99:2 (May), pp. 52–7.
_______. 2010. “Are the New Jobs Good Jobs?” In Katharine G. Abraham, James R. Spletzer, and Michael Harper (eds.), Labor in the New Economy. Chicago: University of Chicago Press.
Bishow, John L. 2009. “A Look at Supplemental Pay: Overtime Pay, Bonuses, and Shift Differentials.” Bureau of Labor Statistics publication, available at www.bls.gov/opub/cwc/cm20090317ar01p1.htm.
Bureau of Economic Analysis (U.S.). 2012. Local Area Personal Income and Employment Methodology (April). Available at www.bea.gov/regional/pdf/lapi2010.pdf.
Congressional Budget Office (U.S.). 2009. “Changes in the Distribution of Workers’ Annual Earnings Between 1979 and 2007.” Available at www.cbo.gov/publication/41221.
_______. “Changes in the Distribution of Workers’ Hourly Wages Between 1979 and 2009.” Available at www.cbo.gov/publication/22010.
Department of Labor (U.S.), Office of the Secretary. 2005. Submission for OMB Review: Comment Request, Apr 8. Available at tinyurl.com/6bwrgt5.
Fisher, Jonathan and Christina Houseworth. 2012. “Occupation Inflation in the Current Population Survey,” U.S. Census Bureau, Center for Economic Studies, Discussion Paper CES 12-26. Available at www2.census.gov/ces/wp/2012/CES-WP-12-26.pdf.
Foster, John Bellamy. 2011. “The Ecology of Marxian Political Economy,” Monthly Review 63:4 (Sept.). Available at monthlyreview.org/2011/09/01/the-ecology-of-marxian-political-economy.
Foster, John Bellamy and Robert W. McChesney. 2012. The Endless Crisis: How Monopoly-Finance Capital Produces Stagnation and Upheaval from the USA to China. New York: Monthly Review Press.
Foster, John Bellamy and Fred Magdoff. 2008. “Financial Implosion and Stagnation: Back to the Real Economy,” Monthly Review 60:7 (Dec.). Available at monthlyreview.org/2008/12/01/financial-implosion-and-stagnation.
Galbraith, James. K. “Muddling Towards the Next Crisis: James Kenneth Galbraith in conversation with The Straddler,” The Straddler, Winter 2013, www.thestraddler.com/201310/piece2.php.
Kliman, Andrew. 2012. The Failure of Capitalist Production: Underlying Causes of the Great Recession. London: Pluto Books.
Kliman, Andrew and Shannon D. Williams. 2012. “Why ‘Financialization’ Hasn’t Depressed U.S. Productive Investment.” Available at http://akliman.squarespace.com/writings/.
Magdoff, Fred and John Bellamy Foster. 2013. “Class War and Labor’s Declining Share,” Monthly Review 64:10 (March). Available at monthlyreview.org/2013/03/01/class-war-and-labors-declining-share .
Mishel, Lawrence, Josh Bivens, Elise Gould, and Heidi Shierholz. 2012. The State of Working America, 12th Edition (an Economic Policy Institute book). Ithaca, NY: Cornell University Press.
Mohun, Simon. 2013. “Unproductive Labour in the US Economy 1964-2010,” Review of Radical Political Economics (forthcoming).
Moylan, Carol E. 2008. “Employee Stock Options and the National Economic Accounts,” Survey of Current Business (Feb.), pp. 7–13. Available at www.bea.gov/scb/pdf/2008/02%20February/0208_stockoption.pdf.
Sweezy, Paul M. 1995. “Economic Reminiscences”, Monthly Review 47:1 (May), pp. 1–11.
Notes
[1] The NIPA-based share uses the figures for compensation of employees in NIPA Table 1.12, line 2 and for GDP in NIPA Table 1.1.5, line 1. URLs of the main data sources used in this article are provided in Appendix 1.
[2] Depreciation costs are losses that represent reductions in the value of the corporations’ structures, equipment, and software––known collectively as fixed assets or fixed capital––stemming from their use in production (wear and tear), obsolescence, aging, and accidental damage. Similarly, other costs of production––for raw and semi-finished materials, energy, and services provided by non-employees––are also not counted here as profit. They do not need to be taken into account explicitly because they have already been excluded; GDP is the difference between “gross output” and the cost of these “intermediate inputs.”
[3] The gross value added and compensation figures come from NIPA Table 1.14, lines 1 and 4. Profit is gross value added minus compensation of employees and the historical-cost depreciation of corporations’ fixed assets, reported in the Bureau of Economic Analysis’s Fixed Asset Table 6.6, line 2. I use historical-cost figures for depreciation because this is the common practice of business accountants and because doing so eliminates the volatility caused by short-run changes in asset valuations that affect current-cost depreciation figures. In the context of this article, the choice of depreciation method makes no real difference, since changes in compensation and profit share trends that are produced by a change in the method of depreciation are ipso facto not caused by changes in the balance of power between capital and labor.
[4] The corporate-sector compensation shares in Figures 4 and 5 are the same. See note 3 for sources of data used in Figures 3 and 4. To construct the business-sector compensation share shown in Figure 5, I divided compensation (in NIPA Table 1.13, line 4 plus 11) by net value added, which is gross value added (in NIPA Table 1.3.5, line 2) minus historical-cost depreciation of fixed assets (in the Bureau of Economic Analysis’s Fixed Asset Table 6.6, lines 2 and 5 minus lines 8 and 9).
[5] Between 1984 and 2007, income-assistance benefits (cash welfare benefits, Medicaid, food stamps, Earned Income Tax Credit refunds, etc.), which accrue overwhelmingly to the poorest segment of the population, together with Medicare benefits in excess of Medicare taxes, were on average equal to 100% of the government social benefits that weren’t funded by means of these taxes. (See NIPA Tables 3.6 and 3.12; income-assistance benefits are the sum of lines 21–25 and line 31 in Table 3.12.) Magdoff and Foster acknowledge (in their endnote 21) that “the working class … can be seen as including many of those on public assistance and who have retired as well, along with dependents.” But the phrase “many of those on public assistance” is a bit troubling. Who are the other recipients of public assistance, the “underclass”?
[6] Of course, the working class receives a small fraction of the interest and dividends, while top executives receive a small fraction of employee compensation (a matter which will be discussed below). It would be very difficult to estimate the size of these “small fractions,” and a huge amount of guesswork would be involved. It seems reasonable to assume that they more or less offset one another, and that the trends shown in Figure 6 are approximately correct.
[7] The income data come from NIPA Table 2.1. Working-class personal income is line 2 plus the difference between lines 17 and 25. Property owners’ personal income is the sum of lines 9, 12, 14 and 15. Net Domestic Product is reported in NIPA Table 1.7.5, line 30.
[8] This does not imply, however, that capital accumulation (i.e., net investment in production) fell as a share of corporate profit. Instead, increased borrowing by corporations enabled them to pay out more money in interest and dividends without reducing net investment as a share of profit. See Kliman and Williams 2012.
[9] The CES figures for all nonfarm private-sector workers and P&NS workers are reported in CES Tables B-3 and B-8, respectively. NIPA wages and salaries of private-sector employees are reported in NIPA Table 1.12, line 5.
[10] A forthcoming article by Simon Mohun (2013) argues that it is reasonable to allocate all of the discrepancy between the two total wage bills to managerial and supervisory employees. However, it is completely unreasonable, as I show in Appendix 2.
[11] All other references to OES data in this article pertain to the full dataset, which includes wages of government employees. In the full dataset, it was also the case that 9.2% of employees were in management occupations or first-line supervisors/managers. The CES employment figures for all private-sector workers and P&NS workers are reported in CES Tables B-1 and B-6, respectively.
[12] I am not referring here to “high-level professionals, such as doctors, lawyers, and accountants,” who Magdoff and Foster consider to be non-working class, because most of these employees seem to be P&NS workers. According to chapter 2 of the Bureau of Labor Statistics’ Handbook of Methods (www.bls.gov/opub/hom/homch2.htm), nonsupervisory employees “include those individuals in private, service-providing industries who are not above the working-supervisor level. This group includes individuals such as office and clerical workers, repairers, salespersons, operators, drivers, physicians, lawyers, accountants, …” (emphasis added).
[13] For this reason, the Bureau of Labor Statistics planned to discontinue publication of P&NS data; it later decided to keep the P&NS series but also publish its alternative measure that takes all private-sector workers into account.
[14] There were about 600,000 employees in the top 10%, approximately double the number of chief executives.
[15] A study by the Congressional Budget Office (2009, Table 1) indicates that, in 2007, a person with annual earnings of at least 2.4 times median earnings was in the top 10%. Combining this with earnings differentials in 2005 between the top 1%, 5%, and 10%, computed using data in Table 3 of the same study, I estimate that one needed earnings of at least 3.2 times or 6.7 times median earnings to be in the top 5% or top 1%, respectively. It is noteworthy that 2007 OES data also indicate that 2.4 was the median-wage multiple needed for inclusion in the top 10%. The OES dataset further indicates that $171,680 was 5.5 times the median annual wage in 2007. Since 5.5 is about two-thirds of the way between the top 5% and top 1% median-earnings multiples obtained from the Congressional Budget Office study, this suggests that earnings of $171,680 probably placed one in the top 2% or 3% of all wage earners.
[16] The share of total wages received by the top 10% of management employees is their average wage-rate multiple (in the first row of the table) times their share of total employment. The table assumes that their share of total employment was a constant 0.45%. To compute their share of total output, I multiplied their share of wages by 61%, the average figure for employee compensation as a share of net value added in the U.S. total-business sector between 1970 and 2007 (see Figure 5).
[17] The total compensation and wage-and-salary data are reported in NIPA Table 2.1, lines 2 and 3, respectively.
[18] Net Domestic Product is reported in NIPA Table 1.7.5, line 30.
[19] CPI-W and CPI-U-RS data are available at www.bls.gov/cpi/#tables and www.bls.gov/cpi/cpirsdc.htm, respectively. The PCEPI is reported in NIPA Table 1.1.4, line 2.
[20] P&NS workers’ average weekly and hourly earnings are reported in CES Table B-8.
[21] The Monthly Review school has long disapproved of American working people’s “seemingly endless demand for superfluous, even toxic, products” (Foster 2011). This complaint about the products they purchase, and their supposed lack of utility, is a general one; it applies across the board. So why do Magdoff and Foster single out nonwage compensation here, while bypassing the supposedly “diminishing use-value” provided by products bought with cash wages?
[22] The data come from Table 3 of the U.S. Census Bureau’s “Historical Poverty Tables – People.” Data for persons 18 and older are not available for the 1960–1965 period.
[23] The data come from Table H-10AR of the U.S. Census Bureau’s household income tables.
[24] The monthly benefit data come from Table 6.A2 of the Social Security Administration’s Annual Statistical Supplement for 2012, available at www.ssa.gov/policy/docs/statcomps/supplement/2012/6a.html. Only selected years’ benefits are reported for years prior to 1980.
[25] I used the CPI-W for the period between 1960 and 1978, and the CPI-U-RS for the period between 1978 and 2010. Use of the CPI-W gives questionable results, especially in long-term analyses, since it is not a consistent series. The CPI-U-RS series begins with 1978. See note 19 for sources of the deflators.
[26] The earnings data come from the Current Population Survey and are available at data.bls.gov/cgi-bin/surveymost?le. See note 19 for sources of the deflators.
[27] The study used the PCEPI to adjust for inflation. The data are for people between 16 and 64 years old. Workers’ wages were weighted by their hours worked.
[28] I used NIPA data to obtain the ratio. I had to estimate the P&NS wage share in the total economy because OES data for private-sector wages are not available for years prior to 2009, nor does the P&NS category conform closely to OES occupational categories. My procedure assumes that P&NS workers’ share of wages in the total economy is the same as their share in the private nonfarm sectors, which seems reasonable. In any case, any estimation error does not affect my final estimate of non-management/supervisory workers’ share of wages, since the final estimate doesn’t make use of the P&NS category.
[29] This procedure assumes that P&NS and other workers’ shares of OES wages are the same as their shares of CES wages. This assumption likewise has no effect on my final estimate of non-management/supervisory workers’ share of wages (see note 28). The definitions of wages (or earnings) in the two series are very similar, except that CES earnings include overtime and shift-differential pay, which OES wages exclude, while OES wages include tips, which CES earnings basically exclude. These differences pertain almost exclusively to the wages of P&NS workers. Since the differences tend to offset one another, and since they pertain to small fractions of total wages (on the economy-wide level), it seems likely that P&NS workers’ share of wages in the two series is more or less equal.
[30] To obtain the total wages (and employment) of management/supervisory employees, I counted everyone employed in “management occupations,” all “first-line supervisors/managers” employed in other occupations, all other employees classified as supervisors (“gaming supervisors” and “aircraft cargo handling supervisors”), as well as “slot key persons” and “farm labor contractors.”
I used OES data instead of data from the Current Population Survey (CPS) because the CPS underestimates management employees’ earnings and overestimates their share of employment. For example, 2012 CPS figures (available at www.bls.gov/cps/cpsaat39.htm) indicate that the median annual wage of chief executives was only $107,120, or 2.68 times the median wage of all workers, and that they were 0.98% of all employees; OES figures indicate that their median annual wage was $168,140, or 4.84 times the overall median wage, and that only 0.20% of employees were chief executives. Unlike the OES and other datasets used in this appendix, which are based on information provided by businesses, the CPS data are self-reported by individuals. Katharine Abraham and James Spletzer (2009, 2010) suggested that the CPS data for management occupations are seriously flawed and that individuals’ tendency to exaggerate their occupational status is a main cause of the problem. Moreover, in a study that examined changes in CPS participants’ self-reported occupational status, Jonathan Fisher and Christina Houseworth (2012) found that the CPS data themselves contain evidence of such “occupation inflation.” Since the CPS is a joint project of the Bureau of Labor Statistics and the Bureau of the Census, it is noteworthy that Abraham is a former Commissioner of the former, Fisher is employed by the latter, and Spletzer has been employed by both bureaus.
[31] The data are reported in ECEC Table 2, available at www.bls.gov/ncs/ect/#tables.
[32] This procedure assumes that the percentages are not affected by the exclusion of military personnel. This assumption seems reasonable, since active-duty military personnel were only 1% of the workforce. The procedure also assumes that supplemental pay, as a percentage of pre-supplement wages, is the same for management and supervisory employees as it is for management, business, and financial employees. In a study that examined the 2001–2007 period, Bishow (2009, Chart 2) compared supplemental pay as a percentage of cash compensation among workers who received some supplemental pay. He estimated that the percentage for employees in “management occupations” was indeed almost identical to the percentage for those in “business and financial operations” occupations. He provided no figures for supervisory workers employed in non-management occupations. It seems likely that their supplemental-pay percentage is less than that of employees in management occupations, which implies that my estimate overestimates the share of supplemental pay received by management/supervisory employees, but to an unknown extent.
[33] Obviously, this procedure overestimates management/supervisory employees’ share of stock-option income, but probably not to a great extent. I estimated the amount of exercised stock-option income by subtracting stock-option expenses reported in corporate income statements from their tax deductions for stock-option expenses (see Moylan 2008, p. 10). The income-statement figure reflects the fair value of the stock options that are granted, when they are granted, while the tax deductions reflect the amount realized, when the options are exercised. The difference measures capital-gains income obtained through the exercise of options. There is a bit of a timing problem here—what should be subtracted is not the fair value of options awarded in 2007, but the fair value, at time of award, of the options exercised in 2007. However, I have no data on the latter and my procedure seems to be a reasonable proxy under the circumstances. The data are reported in “Table 1: Corporations Filing Form 1120, Schedule M-3, by Size of Total Assets” (Part III, lines 9(a) and 9(d), available from the Internal Revenue Service at www.irs.gov/uac/SOI-Tax-Stats-Corporate-Schedule-M-3. I used the income-statement figure for “parachute payments” from the same table (Part III, line 14(a)) to estimate the small amount of golden parachute income (0.03% of the gap between P&NS wages and total NIPA wages).
[34] The railroad industry and the military are not covered by the unemployment insurance system. In addition, some workers who work in covered industries are themselves not covered: some private-household workers; some farmworkers as well as some farm labor contractors and their employees; members of religious orders who work in educational institutions, hospitals, and religious organizations and are paid in kind; workers in some nonprofit organizations that have fewer than four employees; interns and student nurses working in hospitals; prisoners; students employed by their institutions of higher education; and so on (see Bureau of Economic Analysis 2012, pp. II-3 to II-7). Because relatively few people in these latter groups of workers seem to be management/supervisory employees, my procedure probably overestimates management/supervisory workers’ share of the NIPA adjustments, but to an unknown extent. The NIPA adjustments are reported in NIPA Table 7.18.
=====
The foregoing is the corrected, April 17, 2013 version of the article. The original, uncorrected version of April 10 is here.

I cannot speak for the MR editors’ use (or abuse as you seem to show) of statistics, but their article in this case seems to be aimed at countering the profit-squeeze explanations of capitalist crisis advanced by people like Brenner, Kotz, etc.
That said, comrade Kliman’s counter claims that the capitalist class’ war on the working class have not been THAT much of a smashing success is itself an exercise of “going to great lengths” to counter their argument. The data produced by various Keynesian left-liberal think tanks and research institutes (EPI, CEPR, PERI, CAP, etc.) have all shown similarly grim trends. In fact, it’s curious that comrade Kliman would use the example of Social Security to demonstrate how Foster/Magdoff ignore the influence of state transfers in their calculations of the working classes’ declining share. EPI economist Monique Morrissey has shown in several briefing papers over past few years that “that weak and unequal wage growth accounted for more than half the projected Social Security shortfall that has emerged since 1983.” Basically, the rich have been capturing so much of the income gains since the 1980s that what is paid in by average workers is not enough to keep the fund growing at the necessary pace. In any event, why the MR editors would make this awkward and sloppy attempt to show that things are even WORSE than they seem is a ponderous question indeed (perhaps they were desperate for some original content) – it seems like it would be satisfactory to simply rely on the mainstream analyses on this point.
Nevertheless, I think it is worth pointing out that, while I have not read Kliman’s book on the crisis, his summary of his position leaves me wondering what the real difference between MR and his account of the crisis really is (certainly I was struck by his use of the phrase “Karl Marx’s theory of capitalist crisis” as I was unaware that he ever came up with a singular, fully explicated/developed explanation. And speaking of Monthly Review, they published in their latest issue a piece by a German Marxist economist Michael Heinrich that challenges rather forcefully the notion that Marx’s final thoughts on crisis in capitalism were represented by the “Tendency of the Profit Rate to Fall”). It’s true, of course, that MR has an “underconsumptionist” component to their own understanding of crisis, but reducing their argument to that component alone is pretty dishonest. Certainly they should be given some credit for being among the first to identify the issue of “financialization” within the U.S. economy. I agree certainly with Foster et al that the tendency of “orthodox Marxists” to resort to neoclassical/bourgeois economists’ studies/arguments to dismiss the issue of oligopoly (the concentration of capital) within the advanced sectors of the U.S. economy and increasingly the world is rather telling of their own theoretical/ideological inconsistencies and fallacies.
In conclusion, I hope to see an official response by MR to comrade Kliman’s criticisms – especially given their gravity. Has he formally submitted these criticisms to MR? I hope so…
The first paragraph of “dermokrat’s” comment seems to suggest that the Magdoff-Foster article is not an attempt to defend their prior work from my criticisms, and not an effort to defend their underconsumptionist theory of capitalist crisis. However, if you read my criticisms of their earlier work, you see that the new article deals with them, even though it fails to cite them anywhere. And “countering the profit-squeeze explanations of capitalist crisis advanced by people like Brenner, Kotz, etc.” is a way of defending their underconsumptionist theory of capitalist crisis.
The second paragraph attempts to dismiss my findings, interpretations, and arguments by appealing to authority. That’s not logically sound argumentation. And I don’t think the left-liberal think tanks are unbiased, disinterested sources of information and analysis, to put it mildly.
I don’t see how the stuff on Social Security funding is at all relevant to any point made in my article. If it is relevant, the author of the comment doesn’t tell us how. (BTW, in every year during the 1984-2008 period, employee/employer/self-employed contributions to Social Security (OASDI) exceeded the benefits received, so there was no ACTUAL shortfall at any time during that 25-year period. But this is also irrelevant to what I argued in the article.)
The fact is that the income of the working class, taken as a whole, did not fall as a share of net output. The author of the comment does not challenge this fact, nor any other finding in my article. Until s/he or someone else does, I stand by everything I wrote. Statements that only seem to challenge the accuracy of something I wrote, but actually fail to do so, don’t count.
On the third paragraph: yes, Marx had a theory of capitalist crisis. It wasn’t “fully explicated/developed,” in the specific sense that Volume III of Capital was not prepared for publication, but it exists nonetheless. To see it, one has to interpret the text in the accepted way, using the “principle of charity”–i.e., interpret it so as to make it make sense. Heinrich does the opposite; he tries to smash it into discordant bits, in order to make Marx’s theory disappear. Why?!
His strategy doesn’t succeed in other ways, either. For instance, why did Marx again and again write that the law of the tendential fall in the rate of profit is the most important law of modern political economy? The view that the law undergirds his theory of crisis explains this repeated insistence. Heinrich’s view that he had no crisis theory does not. And Heinrich offers no alternative explanation of these statements of Marx. Not surprisingly, he doesn’t even mention them.
A jointly authored response to Heinrich is in progress.
Since the author of the comment seems to be interested in honesty, I’d appreciate a denunciation of Heinrich’s failure to mention that Marx repeatedly held that the law of the tendential fall in the rate of profit is the most important law of modern political economy. And I’d appreciate a denunciation of Magdoff and Foster’s failure to cite my work that criticized the claims made in their 2008 article, which they defend in the new article.
As for my supposed dishonesty because I didn’t say that their crisis theory contains other elements in addition to underconsumptionism, why is that dishonest? Is “Fido is a dog” a dishonest statement just because it doesn’t say that Fido is 4 years old, male, spotted, …? As for the monopoly stuff, it is one of the bells and whistles added onto the MR underconsumptionist theory of crisis, bells and whistles that the theory doesn’t actually require. After all, in the passage from Foster and McChesney that I quoted, we read: “Capitalism, throughout its history, is characterized by an incessant drive to accumulate …. But this inevitably runs up against the relative deprivation of the underlying population …. Hence, the system is confronted with insufficient effective demand––with barriers to consumption leading eventually to barriers to investment.” Note the words “throughout its history” and “inevitably.”
As for the final paragraph, MR would of course not publish my article–they don’t dislike ALL monopoly. So why should I have delayed publication of my article while waiting for them to reject or ignore a submitted article. If the point is that I should “formally submit my criticisms” after the fact, I have no idea of what this might mean.
I gotta tell you, Andrew, while economics is not my area of expertise, reading of your paper suggests (at least to me) that it is exactly the type of arguments that will be taken out of context and used by the right wing to justify further oppression of the underprivileged and retirees; especially dismantling and reducing Social Security payments and privatizing medicare…the very values that many Seniors depend on to exist in relative health. Some arguments like this, even if backed up by data, need to be carefully considered relative to the overall effect and potential for distortion, prior to publication, especially in this society, tending toward fascism and overall domination by the wealthy oligarchs.
Jasenn,
I wouldn’t have to correct the record if Monthly Review et al. didn’t persist in distorting it. So the responsibility here rests with them. As you know, they use their empirical work to serve definite political and ideological ends, too.
So if I don’t shut up, what I say can be bent to serve certain political and ideological ends, while if I do shut up, my failure to speak out can be bent to serve certain political and ideological ends. The only alternatives are to capitulate to one side or another or else to pursue an independent path.
I believe in ruthless criticism in the sense Marx used the term, including the first part: “I am referring to ruthless criticism of all that exists, ruthless both in the sense of not being afraid of the results it arrives at and in the sense of being just as little afraid of conflict with the powers that be.”
Andrew,
I see your dilemma and agree with it. But these right wing ideologues are so destructive, I fear they will use your scientific sense to justify one of their right wing attacks, once again.
Jasenn
Foster & Magdoff’s sloppiness in the use of statistics, which this article painstakingly details, is really shocking. It actually constitutes intentional fraud, since all their “mistakes” happen to aid the story they want to tell. What is even more shocking is that their inaccurate and politically-based economic story is in fact a continuation of 60 years of “Monthly Review” stories dominating the American left. This has been a major factor in the left’s disorientation, IMO. It’s time we had some serious review of their stuff and some intelligent debate about it, rather than having the authors continue to restrict themselves to speaking before their fans.
Jasenn
The ‘right wing ideologues’ would just as quickly arrive at the same conclusion through economic necessity, without knowing exactly how or why.
The thing is, Andrew Kliman shows that the right wing is, in a sense, correct. If workers’ compensation doesn’t get slashed, the rate of profit will not recover, and capitalism will continue to be stagnant and crisis-prone. Likewise, if workers resist and win concessions, the rate of profit will fall and capitalism will become really really REALLY unstable and crisis-prone.
The right wing considers this a mortal evil because they are trying to save capitalism, but why should this be an evil circumstance for us? Don’t we want capitalism to be unstable and crisis-prone?
The Monthly Review school is spinning the fairy tale that the working class can win improvements in their standard of living AND make capitalism function better at the same time. Kliman is saying it is one or the other: either workers’ standards of living must go, or capitalism must go. Late-capitalism is not compatible with a decent life for the working-class.
Sure, it makes opportunistic sense to spin the Monthly Review fairy tale because most average people still consider capitalism eternal and socialism an instant gulag-fest and/or inherently broken/inefficient/unworkable system, so if the decision comes down to sacrificing their own standards of living to keep capitalism afloat or insisting on improving their standard of living but killing capitalism, a lot of people will probably volunteer to slash their own standards of living to keep capitalism alive and avoid the “even worse fate of socialism.”
This is why we need to combine Kliman’s critique with a positive proposal of how socialism would actually work so that there is a positive alternative to make the collapse of capitalism not seem like an apocalypse to be avoided at all costs.
Excellent points, Matthew Opitz. The next question how could this proposal be organized and with whom?
Hello prof.kliman there is this recent paper https://www.triple-c.at/index.php/tripleC/article/download/639/720?inline=1#ref44 that replies to some of your criticisms and others of heinrich i was wondering what would be your opinion on it maybe if you could make a blog on the marxist humanist initiative responding to it ? https://ibb.co/k4d5rL
https://ibb.co/b1Cn5f
https://ibb.co/f7Qwy0
https://ibb.co/m6Did0 he also appears to criticize your and klimans responce in his book as well this is a free pdf
http://b-ok.xyz/book/2825146/9ad226 to it