
[MHI Note: This article originally appeared in Truthdig, a progressive journal of news and opinion published by Zuade Kaufman and edited by Robert Scheer, on April 9, 2014. Republished with permission.]
==========
Editor’s note: Three weeks ago, at the recommendation of leading post-Keynesian thinker Michael Hudson, I contacted Pace University economist Andrew Kliman with a question. I was preparing to write an article based on a figure published in the July 2011 issue of Mother Jones and I wanted verification by an expert. “Productivity has surged, but income and wages have stagnated for most Americans,” the article reported. “If the median household income had kept pace with the economy since 1970, it would now be nearly $92,000, not $50,000.”
Believing that it powerfully summed up the economic theft committed against American workers over the last four decades, I repeated this claim in print and conversation for two and a half years. But I can’t say it any longer with the same confidence. When I showed it to Kliman, he said I had been misinformed.
“The original source is probably the Economic Policy Institute (EPI), which is one of the sources of ‘Productivity/income’ info listed at the bottom of the story,” he wrote to me in an email. “They do a lot of publicizing of the supposed growing gap between productivity growth and wage/compensation growth. I find their stuff on this very misleading.” He went on to say he had crunched the EPI’s numbers and discovered that the pay Mother Jones claimed was being kept from workers couldn’t possibly be given to them. If it was tried, he said, there would be nothing left for the corporations—that is, the shareholders, owners and others who receive income but play no role in production.
His confidence slowed me down. From policymakers and credentialed experts to committed activists on the left, nearly everyone and their mothers seem to believe corporations have been fleecing workers out of an increasing share of their earnings and keeping it for themselves. The “productivity/compensation gap,” as it has come to be called, is a key tenet of left-wing orthodoxy when it comes to explaining what happened to Americans over the past 40 years.
As a nontechnical person, I tried to get Kliman to explain his conclusions to me in language I could understand. I realized before long that it would be simplest if he tried to put his ideas into article form; by helping him render them in terms mortals could grasp, I would be able to comprehend what he was saying. And others—including those who are better qualified to review and evaluate his work—would have a chance to do the same.
The article that follows is a partial result of that effort. It appears on Truthdig not as a final word by an expert journalist, but as a scholar’s critique of the interpretations of definitions and data used by the U.S. government and many of the country’s leading institutions—which interpretations are shaping conversations (including a debate that led the Opinion pages of The New York Times on March 30), public and professional opinions, and national policies and practices. Conclusive discussion of the matter by capable experts seems urgent because, if Kliman’s inferences are correct, they call for lawmakers set on economic justice to address themselves to the growing inequality of income between workers—from those who sweep floors to the occupiers of boardrooms—not just the share of income taken by businesses themselves.
A second article by Kliman, concerning precisely how income among employees came to be skewed in the manner it is today, and in which there will be intense discussion about the official definitions of “wages,” “profits” and “income” is planned to appear on Truthdig in the future.
Correction: An earlier version of this introduction described Dr. Hudson as a neo-Keynesian and referred to employees as “workers” in the final paragraph.

Photo by puroticorico (CC BY-SA 2.0)
Are Corporations Really Hogging Workers’ Wages?
By Andrew Kliman
What if some of the most respected economists in the world told you that as an employee, your pay is 40 percent lower than it would be if it had increased in recent decades at the same rate as your productivity? If you are a typical American worker, that is how large the gap in your pay became by 2011, according to the Economic Policy Institute, one of the most trusted liberal think tanks in the nation.
In its 2012 study, “The State of Working America,” the EPI reported that between 1973 and 2011, the goods and services produced per hour of work (which economists call productivity) in the American economy “grew strongly, especially after 1995, while the typical worker’s compensation was relatively stagnant.” Productivity increased by more than 80 percent in the interim, even after adjusting for inflation, but the hourly compensation of those who held production and nonsupervisory positions increased by less than 11 percent. The EPI contended that this “divergence of pay and productivity has meant that many workers were not benefiting from productivity growth—the economy could afford higher pay but was not providing it.”
The “productivity/compensation gap,” as journalists and academics call it, has become a flashpoint in the debate over income inequality. Equipped with statistics like those produced by the EPI, trusting activists and members of the press point to the supposed gap as proof that corporate profits have been rising at the expense of employees’ compensation—not just since the Great Recession, but throughout the last four decades. (For an example of such a claim, see the piece written by Doug Henwood, editor of the Left Business Observer, in the opinion pages of March 30’s New York Times.)
Careful analysis shows that before the recession, average hourly compensation of employees at large did keep pace with productivity—unless “compensation” and “productivity” are measured in a highly misleading way. The following graph, based on the same government statistics of employee compensation cited by Henwood and others, looks at the share of net domestic product that U.S. employees received from 1970 until the start of the Great Recession. There was essentially no upward or downward trend in their share, either in the corporate sector or in the business sector as a whole. This means that employees’ production per hour increased at essentially the same pace as their compensation per hour, not more rapidly.
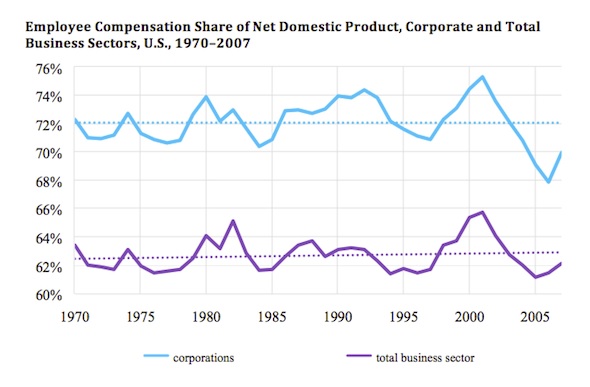 Sources: See note 1.
Although the compensation of many workers did lag behind productivity to some degree, it was misleading measurement that produced the whopping 40 percent gap the EPI tells us existed as of 2011. The truth is, it just isn’t the case that “the economy” could have afforded to close the supposed gap by increasing employee “compensation” in tandem with employee “productivity” as these terms are defined by the EPI. All we need to do to understand this is to add the supposedly missing compensation and see what happens.
The graph below looks at how income generated in production by U.S. businesses and nonprofits between 1972 and 2011 was divided up. The blue part is the percentage used to pay employees. (Before the recession of 2008 it was visibly stable. This fact alone indicates that, on average, employee compensation wasn’t declining compared with employee productivity.) The orange area represents non-income taxes, transfer payments such as fines and court settlements; the green, interest to lenders and various kinds of rents and royalties classified as rental income. The purple area is the supposedly missing compensation of production and nonsupervisory workers, the portion—40 percent as of 2011—that the EPI claims they would have been paid had they received the full benefits of their increased productivity.
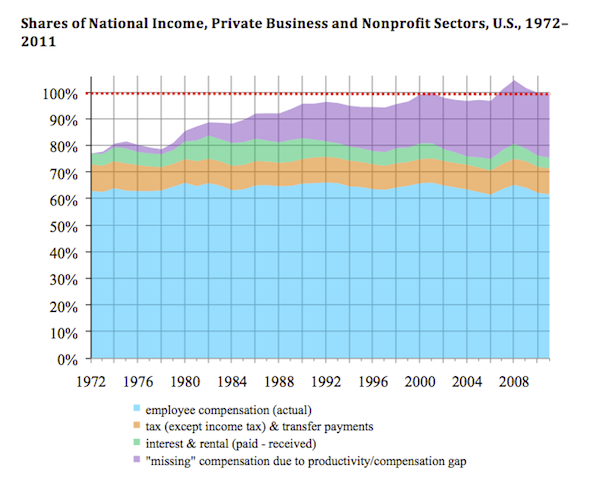 Sources: See note 2.
In 2007, 2008 and 2009, the sum of these four types of income exceeded 100 percent. This means that if workers’ compensation had kept pace with productivity as these terms are defined by the EPI, then nothing—actually less than nothing—would have been left for the companies themselves. Profits paid to corporations and the income received by self-employed people and owners of unincorporated companies would have been negative. Thus, I don’t think it can reasonably be said that “the economy” could have afforded the alleged missing compensation.
Furthermore, this analysis probably understates the consequences of closing the productivity/compensation gap because it excludes farmworkers as well as the approximately 20 percent of workers who are not counted as holding production or nonsupervisory positions.
Another graph shows what would have happened to the profits made by corporations and the incomes of unincorporated owners and the self-employed if typical workers had received their supposedly missing compensation. Profits and other business income have been relatively stable during the last four decades, but they would have declined precipitously if typical workers had received the compensation that the EPI regards as missing. By 2001, business income would have essentially disappeared, and between 2007 and 2009, would have been negative, as the graph shows.
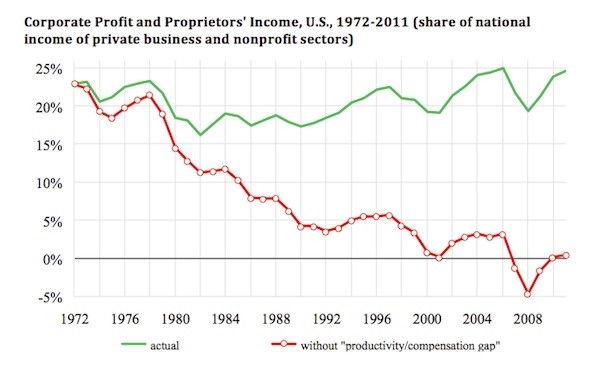 Sources: See note 2.
Where did the EPI go wrong? The problem lies in the peculiar way the institute adjusts productivity and compensation data in order to account for inflation. What results is the age-old problem of comparing apples and oranges.
The numbers EPI analysts used to perform this adjustment are called “price indexes.” They represent the average price of goods and services at particular times. If the EPI had used a single price index to adjust the productivity and compensation numbers, it would have been comparing apples with apples—and it would not have obtained a “productivity/compensation gap” that was so large and so misleading.
But the EPI used two different price indexes. It did this to reflect the fact that the prices of goods and services that workers buy have increased substantially faster than the prices of goods and services that companies produce. (This occurred because the prices of “investment goods”—plant, machinery and other equipment used in production—which some companies produce have not risen as quickly as the prices of consumer goods.) Much of what the EPI regards as a divergence of pay and productivity stems from the quicker growth of consumer prices rather than from the slow growth of pay. To make up for the particularly rapid inflation workers experienced, and thereby eliminate the “divergence of pay and productivity,” their compensation would have had to rise more rapidly than total income. And as we just saw, their share of income would eventually have had to rise to the point where it wiped out all profit and other business income.
It is reasonable to want statistics that reflect the particularly rapid inflation that consumers have experienced. Nonetheless, to offer another analogy, the EPI’s procedure produces a lopsided growth of productivity relative to compensation in much the same way that you would make a car lopsided by deflating the tires a little on one side and a lot on the other. The numbers cannot be fairly compared.
Furthermore, a growing productivity/compensation gap produced in this manner tells us nothing about the distribution of income between employee compensation and corporate profits. If compensation grew more slowly than productivity, it has to be the case that corporate profits grew more rapidly—at least it must be if the analyst involved used a single price index to make the inflation adjustment. But an analyst who used two price indexes might well report that compensation and profits have both grown more slowly than productivity during the last three decades.
So when two price indexes are used, a widening gap between productivity and the compensation of employees doesn’t mean that profits grew more quickly than productivity or that the profit share of the net domestic product (the annual measure of gross domestic product minus depreciation) increased at the expense of the compensation share. As indicated earlier, Henwood’s recent claim in The New York Times that “corporate profits skyrocketed” because “productivity rose 93 percent between 1980 and 2013, while pay rose 38 percent,” is simply incorrect. The “extraordinarily lopsided” growth he reports is produced by lopsided inflation adjustment. As we’ve seen, the gap between “productivity” and average hourly “compensation” grew larger and larger, but the employee-compensation share of the net domestic product didn’t fall. It follows that the remaining share, the profits left for corporations and other businesses, didn’t rise.
Thus, although the typical worker’s share fell to some degree, what actually rose at his or her expense was the share of the income distributed to more highly paid employees. The 38 percent pay rise Henwood cites is the average rise of all employees, from janitors to CEOs. But the pay of professionals, managers and many financial-sector employees grew much faster than the pay of those at the bottom. Growing inequality of compensation among workers is a significant but under-appreciated part of the developing inequality picture, and one I will discuss in a future article.
Notes:
[1] Corporations’ net domestic product (net value added) and compensation data are reported in National Income and Product Account (NIPA) Table 1.14, lines 3 and 4, respectively. Business-sector net output is reported in NIPA Table 1.9.5, line 2, while total business-sector compensation is the sum of lines 3 and 11 of NIPA Table 1.13. Net domestic product is the sector’s contribution to gross domestic product minus depreciation.
[2] The data in this and the following graph pertain to the sectors of the economy in which production/nonsupervisory workers are counted, plus farms. Most of the data come from National Income and Product Account Table 1.13. National income: sum of lines 3, 19, 28, and 49; compensation: sum of lines 4, 20, 29, and 50; tax and transfer payments: sum of lines 9, 27, 35, and 55; interest and rental: sum of lines 8, 26, 33, 34, 53, and 54; corporate profit and proprietors’ income: sum of lines 7, 23, and 32. “Missing” compensation of production/nonsupervisory workers was computed as follows. Real average hourly compensation in the absence of a productivity/compensation gap is the product of the EPI’s productivity series and the ratio of the 1972 values of its real average hourly compensation and productivity figures (both reported in the “4U” spreadsheet of its “Wages” data file). To obtain nominal figures, this hypothetical series and actual average hourly compensation series were multiplied by the CPI-U-RS price index (available here) that the EPI used to obtain its real figures. The difference between the hypothetical and actual nominal figures is the “missing” compensation per hour. Total “missing” compensation is the hourly figure multiplied by the total hours worked by production/nonsupervisory workers, which is 52 times the product of the number of workers employed and their average weekly hours (reported in Current Employment Statistics Tables B-6 and B-7, respectively).
Andrew Kliman is a professor of economics at Pace University in New York and author of “The Failure of Capitalist Production: Underlying Causes of the Great Recession” (Pluto Books, 2012) and “Reclaiming Marx’s ‘Capital’: A Refutation of the Myth of Inconsistency” (Lexington Books, 2007). See his website here.

Be the first to comment