
by Andrew Kliman, author of The Failure of Capitalist Production: Underlying Causes of the Great Recession
Popular struggles today are focused on combatting Trumpism, capitalism’s most-menacing face at present. But left-populists threaten the self-development of these struggles, by attempting to divert them toward opposing “neoliberalism” instead. A crucial part of that effort is the continuing left-populist promotion of the myth that “the 1%’s” share of income skyrocketed under neoliberalism while workers’ incomes stagnated. Fortunately, however, inequality data that haven’t been tortured by left-populist spin doctors continue to roll in.
Part III of Marxist-Humanist Initiative’s 2018 Perspectives thesis, “Resisting Trumpist Reaction (and Left Accommodation),” points out that the economic-populist left vilifies a particular form of appearance of capitalism—“neoliberalism”—rather than capitalism as such, in order to celebrate the welfare-statist capitalism that preceded it:
For some time now, left thinking has characterized our age as a neoliberal age, blaming all of the economic ills of our time, from rising inequality to the Great Recession, on neoliberal policies. … The calls for a new left populism often display an overly romantic and optimistic picture of postwar America, … when the US had a relatively robust welfare state ….
This quote appears in a section of the Perspectives that is aptly entitled “The Mythology of the Populist Left.” One reason this characterization is apt is that the stark contrast that the left-populists draw, between the economic outcomes produced by “neoliberalism” and those produced by welfare-statist capitalism, is indeed a myth. When one steps outside the left-populist “bubble” and looks at data that haven’t been tortured by the left-populist spin doctors, the stark contrast between the economic results of “neoliberal” and welfare-statist capitalism begins to crumble.
I have written several articles about this, and it is a main theme of my 2012 book, The Failure of Capitalist Production: Underlying Causes of the Great Recession. But the not-yet-tortured data continue to roll in. They provide additional support for the needed effort to combat left-populist attempts to divert popular struggles from opposition to capitalism—and its most-menacing face at present, Trumpism and other forms of populism-authoritarian—into opposition to “neoliberalism.”
In recent months, two important studies of US income inequality have been published. One is by the nonpartisan Congressional Budget Office (CBO). The other is by Gerald Auten and David Splinter, tax specialists working for the US Treasury Department and Congress’s Joint Committee on Taxation, respectively. To understand the significance of their findings, we need to contrast them to the data produced by Thomas Piketty, Emmanuel Saez, and associates. As we all know, the latter, especially Piketty, author of Capital in the Twenty-First Century, have become poster boys of the anti-neoliberal “left.”
Within the left-populist bubble, previous criticisms of the data generated by Piketty, Saez, & co. have frequently been airily dismissed, on the grounds that the critic is either too conservative or, in my case, a too-radical challenger of anti-neoliberal “left” orthodoxy. But the CBO is staffed by nonpartisan professionals, and a colleague has said the following about the first author of the Auten-Splinter study: “Have you met Gerry Auten? He’s just not the kind of guy who has an agenda, unless getting all the columns in his spreadsheet to add up counts as an agenda.”
Piketty and Saez produced the following graph, which has been republished … well, basically everywhere. It indicates that the income share of “the 1%” in the US has skyrocketed by a truly phenomenal degree, and—importantly—that the rise matches up neatly with the move from welfare-statist capitalism to “neoliberalism.”
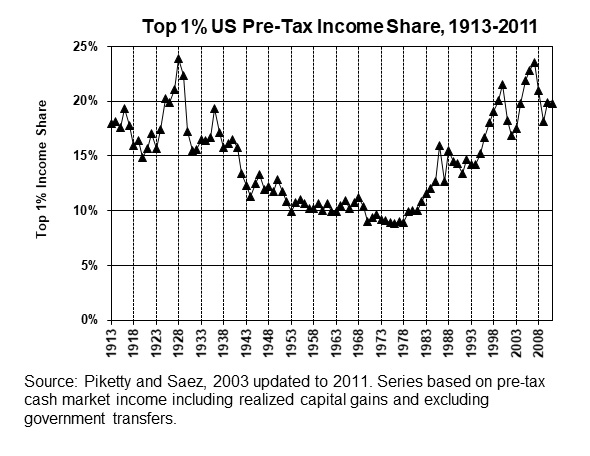
There is little controversy about the idea that inequality rose—to some extent. But the sheer magnitude of the increase that Piketty and Saez have reported, which contrasts markedly with the findings of most other inequality researchers, has led a lot of people, at least people outside the left-populist “bubble,” to suspect that something was not quite kosher. To account for the discrepancy between their numbers and other researchers’ numbers, Piketty and Saez highlighted the fact that their numbers are based on tax-return data, which capture extremely high incomes better than do other data. But other researchers focused on the facts that Piketty and Saez (1) disregarded various forms of income—pension and health benefits paid by employers, welfare benefits, and so forth, (2) looked at “tax units” of shifting size rather than people or size-adjusted households, and (3) ignored the redistributive effects of the tax system.[1]
The new CBO study, published in March, uses the same tax-return data that Piketty and Saez use, but also makes adjustments to it. The CBO factors in the additional income sources mentioned above, and looks at size-adjusted households, and takes redistribution through taxation into account. As the graph below indicates, the CBO finds that there was almost no rise in after-tax income inequality, as measured by the Gini coefficient, between 1986 and 2014.[2] To be sure, there was a huge rise between 1979 (the first year of the CBO study) and 1986, and that rise has not been reversed. Nonetheless, the results make it difficult if not impossible to draw a neat contrast between the effects of welfare-statism and the effects of neoliberalism. The reason Piketty, Saez, and co. found that inequality continues to rise throughout the whole “neoliberal” period is not due to their use of tax-return data. It is instead due to the facts that they excluded major chunks of income, ignored taxes, and looked at “tax units” rather than people or size-adjusted households.
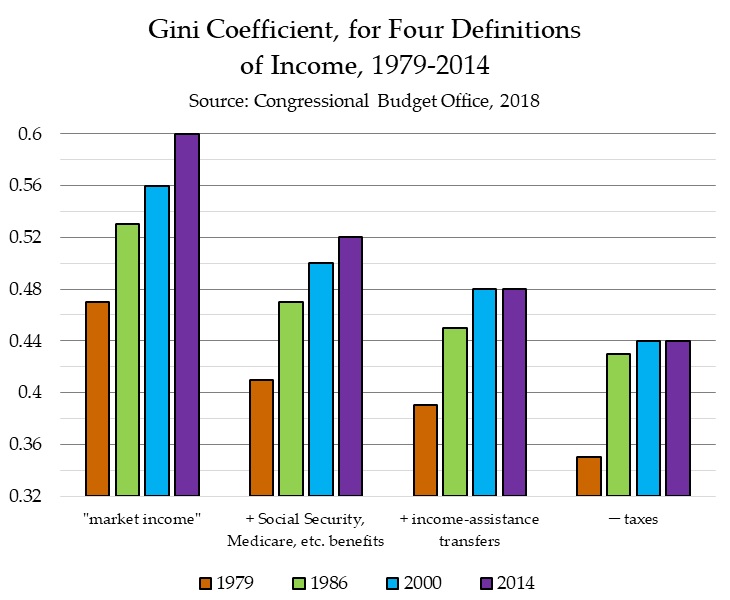
In addition, the CBO data indicate that there were substantial increases in median income—the income of the middle household—between 1979 and 2014. During this 35-year period, median before-tax income rose by 45%, and median after-tax income rose by 51%. This stands in huge contrast to the picture, painted by the Piketty-Saez approach, of stagnant middle- and working-class income throughout the whole of the “neoliberal” period.
But what about that large rise in inequality between 1979 and 1986, which is present in both the Piketty-Saez data and the CBO data? The very careful and innovative study published by Auten & Splinter last November suggests that most of that rise is a statistical artifact. Both Piketty-Saez and the CBO rely mainly on income data contained in tax returns, but these data are not consistent over time.
There were big changes in US tax laws in the 1980s; and as tax laws change, the set of items included in taxable income changes, and companies and people respond to changes in tax rates in order to lessen their tax burdens. Thus, when the tax-return data show that the super-rich are capturing a greater share of “income,” this rise in “inequality” may merely reflect the fact that more of their income is now being reported on tax returns.
For example, in response to the tax-law changes of the 1980s, corporations began to reduce the share of their profits that they retained and re-invested. Instead, they began to distribute a larger share of profits as dividends to shareholders and, possibly, as additional compensation of CEOs and other top executives. But ultimately, income is income, whether it is received in the form of cash dividends and salaries, or is kept by the corporations that shareholders own. Taking account of this fact, and making a several other adjustments—in addition to adjustments like those made by the CBO—Auten and Splinter find that the increase in inequality during the 1980s was much less than the Piketty-Saez and CBO estimates suggest.
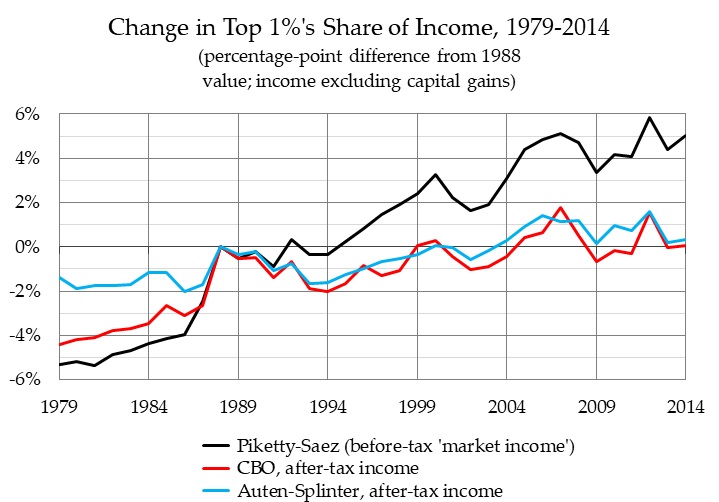
As the following graph shows, both the CBO and Auten-Splinter studies conclude that there was almost no rise in “the 1%’s” share of after-tax income between 1988 and 2014. But where Piketty and Saez report that the “market income” of “the 1%” rose by 5.3 percentage points between 1979 and 1988, and the CBO data imply that it rose by 4.4 points, the Auten-Splinter adjustments eliminate the large majority of that rise. Their after-tax series indicates that “the 1%’s” share of income rose by only 1.4 percentage points between 1979 and 1988, and by only 1.7 points for the whole 35-year period between 1979 and 2014, from 8.4% to 10.1%.[3]
[1] Recently, Piketty and Saez have accepted many of the criticisms of their earlier work and have accordingly produced revised estimates of middle-income income growth and income inequality that are more in line with those of their critics. (See Part V of Marxist-Humanist Initiative’s 2018 Perspectives—pp. 37-8 of online version; pp. 52-3 of pamphlet—for further details.) Since, however, Auten & Splinter’s recent paper focuses on adjustments to the original Piketty-Saez data series, this article’s discussion of Piketty-Saez data is likewise about the original series.
[2] The larger the Gini coefficient, the more unequally income is distributed. The coefficient can range from 0 (if there were complete income equality) to 1 (if one household captured all of the income).
[3] To enable apples-to-apples comparison between the CBO series and the other two series, I recomputed the CBO numbers after removing realized capital gains and estimated federal capital-gains tax.

Be the first to comment