
By Andrew Kliman, author of Reclaiming Marx’s “Capital”: A refutation of the myth of inconsistency.
1. Introduction
Some prominent Marxist and radical economists (e.g., Duménil and Lévy 2004, Husson 2008, Moseley 2008) have argued that “neoliberal” policies and increased exploitation have led to a substantial recovery of profitability since the early 1980s. They therefore dismiss the idea that a persistent fall in profitability is an underlying cause of capitalism’s latest economic crisis. Instead, they typically regard the crisis as an irreducibly financial one–that is, a crisis caused by the “financialization” of capitalism and macroeconomic difficulties resulting from it, as well as by more immediate financial-sector phenomena. This paper will challenge that thesis.
The political implications of this controversy are profound. If the latest economic crisis is an irreducibly financial one, then this implies that:
- We can prevent the recurrence of such crises by doing away with “neoliberalism” and “financialized capitalism.” It is unnecessary to do away with the capitalist system ofproduction– i.e., production driven by the aim of ceaselessly expanding “value,” abstract wealth.
- What the crisis has put on the agenda is the need for financial regulation, activist (“Keynesian”) fiscal and monetary policies, and perhaps nationalization of some or all of the financial sector, rather than a change in the character of the socio-economic system.
If, on the other hand, the crisis is instead a systemic crisis resulting from the underlying tendency for the rate of profit to fall, then such reforms will at best only delay the next crisis. Moreover, while the immense buildup of government debt now taking place in the United States may also delay the day of reckoning by providing temporary artificial stimulus to the economy, it promises to make the next crisis worse when it comes.
This paper will focus on the U.S., because it is the epicenter of the latest global crisis and because data for other countries are not as complete and often not as reliable.[1] It cannot be automatically assumed that the analysis of the U.S. case applies to other countries. But since the U.S. is the epicenter of the crisis–since, in other words, it erupted elsewhere because it first erupted in the U.S. and then spread–I suggest that the relative lack of discussion of other economies does not reduce the adequacy of the paper’s analysis of the long-term economic difficulties underlying the crisis.
My main thesis is that U.S. corporations’ rates of profit declined after the mid-1950s and continued to fall or failed to rebound after the recessions of the mid-1970s and early 1980s; that no new boom followed these recessions because, in contrast to what occurred in the Great Depression and World War II, the amount of capital-value that was destroyed was insufficient to restore profitability and a healthy rate of investment; that the persistent fall in profitability led to sluggish investment, slow economic growth, and a long-term explosion of debt; that the buildup of debt has led to repeated bubbles and the bursting of these bubbles; and that the latest crisis and economic slump are the consequences of the bursting of a gigantic bubble in the housing and stock markets. The continuing fall in, or non-recovery of, the rate of profit is thus a crucial, though indirect, cause of the crisis and slump.
In the next section, I will discuss the destruction of capital-value and I will argue that relative stagnation, the buildup of debt, and related problems that ultimately led to the latest crisis are rooted in the insufficient degree to which capital-value was destroyed in the slumps of the mid-1970s and early 1980s. In section 3, I will document that the rate of profit has fallen and not recovered, and that the rate of capital accumulation fell in response to the fall in the rate of profit. Section 4 will challenge the claim, made by Duménil and Lévy, Husson, and others, that the rate of accumulation instead fell because a “neoliberal” “regime of accumulation” prevailed since the 1980s that encouraged diversion of profits into financial markets and away from productive investment.
Such economists also dismiss the evidence that the rate of profit failed to recover after the slump of the early 1980s, by showing that the current-cost “rate of profit” they favor has indeed rebounded. Section 5 will argue that this contrary evidence is invalid, because the current-cost rate is not a rate of profit in the normal sense of the term. It is not what businesses and investors seek to maximize, it does not regulate their investment decisions, it does not properly measure either their actual or their expected rates of return on investment, it bear no clear relationship to the rates of capital accumulation and economic growth, and it does not properly adjust for inflation.
.
2. Insufficient Destruction of Capital-Value and Relative Stagnation Since the 1970s
Karl Marx argued that there is an ever-present tendency in capitalism for labor-saving technical innovation to lower the rate of profit. Yet he also argued that this tendency is interrupted from time to time by “the destruction of capital through crises” (Marx 1989, p. 127, emphasis omitted)–the destruction of physical capital assets and, more importantly, the destruction of the value of capital assets.
In an economic slump (a recession or depression), physical capital is destroyed as machines and buildings lay idle, rust, and deteriorate. More importantly, debts go unpaid, the prices of financial assets such as mortgage loans and mortgage-backed securities fall, and other prices may also fall, so capital-value, the value of the physical capital as well as the nominal value of financial assets, is destroyed. For instance, if you had purchased shares of stock of the companies included in the Dow Jones Industrial Average for $1000 in September of 1929, the same shares of stock would have been worth only $108 by July of 1932.
Yet the destruction of capital isn’t only a main effect of serious economic crises and the slumps they trigger. It is also a main cause of the booms that follow, because it is a crucial factor that helps to restore profitability. Capitalists invest in equipment, hire workers, and produce only in order to make a profit. So if the expected rate of profit–profit as a percentage of the amount of money they’ve invested– isn’t high enough, there won’t be sufficient investment and hiring, so there won’t be a boom. But by restoring profitability, the destruction of capital sets the stage for a new boom.
Imagine, for instance, a business that can generate $3 million in profit annually. If the value of the capital invested in the business is $100 million, the owners’ rate of profit is a mere 3%. Yet if, as a result of the destruction of capital-value, new owners can acquire the business for only $10 million instead of $100 million, their rate of profit–the return they receive on their investment– is a healthy 30%. Since the purpose of engaging in capitalist production is to get as high a return on investment as possible, the destruction of capital is a tremendous spur to a new boom. Notice that this is the case even in the absence of new markets or rising demand that would lead investors to expect greater profit.
Thus the ground for the post-World War II boom was laid by the massive destruction of capital-value that took place during the Great Depression and the war. At the start of the Depression, it seems that the destruction of capital–which was called “liquidationism”–was actually advocated by conservative economists and policymakers, especially Andrew Mellon, President Hoover’s Treasury Secretary. In his memoirs, Hoover (1952, p. 30) wrote,
Mellon … felt that government must keep its hands off and let the slump liquidate itself. Mr. Mellon had only one formula: “Liquidate labor, liquidate stocks, liquidate the farmers, liquidate real estate.” He held that even panic [in the financial system] was not altogether a bad thing. He said: “It will purge the rottenness out of the system. … enterprising people will pick up the wrecks from less competent people.”
However, it seems that the amount of capital-value that needed to be destroyed in order to restore healthy rates of capital accumulation and economic growth was substantially more than liquidationists had expected. Policymakers in more recent times, understandably afraid of a repeat of the Great Depression and the radicalization of working people that accompanied it, have therefore not allowed free-market forces to proceed unchecked. During the economic slumps of the mid-1970s and early 1980s, and ever since, they have attempted to retard and prevent the destruction of capital. This has “contained” the problem, while also prolonging it–and exacerbating it, since they have repeatedly prolonged the problem by papering over bad debts with ever-mounting amounts of new debt and debt guarantees.
As a result, the global economy has never fully recovered from the slump of the 1970s, certainly not in the way in which it recovered from the Great Depression and World War II. The worldwide growth rate of per capita GDP fell abruptly and sharply in the mid-1970s and it has not recovered substantially since that time (see Table 1). In the U.S., the growth rate of corporations’ output (net value added) also fell abruptly at the same time, and this caused the growth rate of corporations’ compensation of employees to fall to a similar extent. Neither of these growth rates has recovered, either. Other U.S. indicators tell a similar story. For instance, the share of GDP devoted to federal, state, and local government spending on non-military infrastructure projects began a long-term decline starting in 1969 and never rebounded substantially.
Table 1. Indicators of Incomplete Recovery from Slumps of Mid-1970s and Early 1980s
(click to view)
In order to lessen the effects of this relative stagnation, and perhaps in order to overcome it, policymakers have tried to prop up economic growth and profitability artificially throughout the last three decades. In the U.S., the sluggishness has been papered over especially by an ever-growing mountain of mortgage, consumer, business, and government debt. The increase in indebtedness is both a consequence of the relative stagnation and a factor that masks it and delays its impact. (The tactic is very similar to that of a household that can’t pay its credit-card balance. It gets a second credit card, borrows still more, and uses the borrowed funds to pay the first debt. Then it gets a third credit card, borrows, and uses the borrowed funds to service the second debt. And so on.)
As Figure 1 shows, the total debt of U.S. non-financial sectors was remarkably stable, as a share of GDP, through 1981. Since that time, it has almost doubled, as did federal government debt prior to the latest crisis. It even rose rapidly during the middle of the last decade, a period in which it might have been expected to fall, as housing- and stock-market bubbles temporarily produced rapid economic growth. This suggests that the growth of debt–especially mortgage, consumer, and federal government debt–was a crucial cause of the bubbles and economic expansion.
Figure 1. Outstanding Debt as Percentage of GDP, United States, 1950-2009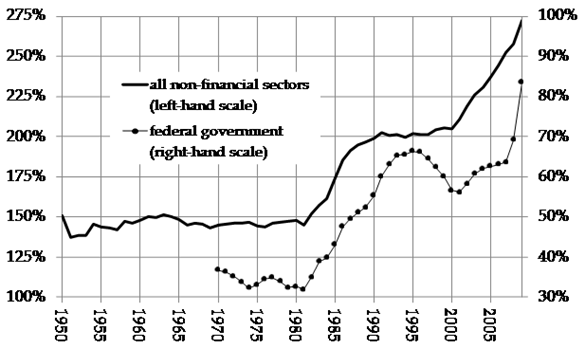
(click to view)
It needs to be stressed that the rising debt burden has been produced in part by conscious government policy. This is true now, as the government pursues the “Keynesian” policy of massive borrowing in order to try to emerge from the slump. It was also true during the preceding, supposedly “neoliberal,” era; rising indebtedness, both public and private, was a key strategy used to manage the economy in the face of long-term relative stagnation.
For instance, easy-credit conditions, brought about by Federal Reserve policies and other means, allowed stock prices and home prices to rise. This was especially so in the period following the collapse of the dot-com bubble, the recession of 2001, the September 11 attacks, and the decline in employment that persisted into the middle of 2003. To keep the economy from sinking further, the Fed lowered short-term lending rates. For three full years, starting in October of 2002, the real (i.e., inflation-adjusted) federal funds rate was actually negative: banks borrowed funds, lent them out, and then paid back less than they borrowed, once inflation is taken into account.
As a result, borrowing rose sharply. And, as borrowed funds were spent on homes and shares of stock, their prices rose sharply as well. This allowed consumers and homeowners to borrow even more and save less. Whereas they saved almost 10% of their after-tax income from 1973 through 1984, the saving rate then fell consistently, to a low of 1.4% in 2005. As the prices of their homes and shares of stock increased, and as their retirement funds, based on stock-market prices, increased as well, consumers tended to treat these increases as if they were actual money being saving. So they tended not to save actual money.
Tax cuts financed by government borrowing were another important strategy during the “neoliberal” period. The federal government reduced corporate income taxes in the mid-1980s, which boosted corporations’ after-tax rates of profit relative to pre-tax rates. Since government spending in excess of tax receipts must be financed by borrowing, it is ultimately additional public debt that propped up after-tax rates of profit. More than three-eighths of the $8 trillion increase in U.S. Treasury debt between fiscal years 1974 and 2007 is attributable to reductions in corporate tax rates below their average level during the 1947-1973 period.
In the long run, however, debt cannot be used to “grow the economy” faster than is warranted by the underlying flow of new value (also known as income) generated in production. Efforts to make it grow faster create bubbles, but bubbles burst. Thus, in the period since the crisis of the mid-1970s, there have been recurrent economic upturns that have rested upon debt expansion. For that reason, they have been relatively short-lived and unsustainable. There was the Third World debt crisis of the 1980s, and then the partial collapse of the savings and loan industry in the U.S. at the end of that decade. Japan entered into a long period of stagnation following a very rapid boom. In the mid-1980s, Mexico experienced another debt crisis, and a few years later there was the East Asian currency crisis that spread to Russia and Latin America. The dot-com stock market bubble burst soon thereafter. And, of course, the recent bursting of the bubble in the U.S. housing and stock markets has triggered the most acute global economic crisis, and the longest slump, since the Great Depression.
Unwilling to allow capital to be destroyed to a degree that is sufficient to restore healthy accumulation of capital, policymakers have responded to the latest crisis by once again papering over bad debt with more debt, this time on a massive, unprecedented scale. In the first 19 months following the collapse of Lehman Brothers in mid-September 2008, the total debt of the U.S. Treasury has increased by more than one-third, from $9.6 trillion to $12.9 trillion. The additional borrowing amounts to more than $10,000 per person. According to projections from the Obama administration–which are far more optimistic than those contained in a recent International Monetary Fund working paper (Celasun and Keim 2010)–the Treasury’s debt will rise to $19.7 trillion by the end of fiscal year 2015, which means that it will have doubled in size in just 7 years. The $10.1 trillion increase in the debt is equal to 8.7% of projected GDP throughout the 7-year period (and, to repeat, the administration’s GDP projections are very optimistic).
If these measures succeed, full-scale destruction of capital will continue to be averted. But for the foreseeable future, the U.S. will confront a debt burden that will be difficult to manage, at best, and probably slower economic growth as interest rates rise in response to the growing debt. Moreover, the huge increase in indebtedness suggests that the next debt crisis could be much worse than the latest one, and therefore that the next wave of panic to strike the financial markets will be even more severe and have more serious consequences.
.
3. Underlying Causes of the Relative Stagnation
I have argued that relative economic stagnation set the stage for the debt buildup and the latest crisis. But what caused the relative stagnation? The most obvious explanation, and therefore the explanation that is prima facie the most plausible, is this:
(1) the rate of profit fell and, because capital-value was not destroyed to an extent sufficient to restore profitability, the rate of profit failed to rebound significantly following the economic slumps of the mid-1970s and early 1980s;
(2) the persistent fall in the rate of profit produced a persistent fall in the rate of capital accumulation;[2] and
(3) the fall in the rate of accumulation led in turn to sluggish growth of per capita GDP, corporations’ output, and compensation of employees, to rising debt burdens, and so on.
Evidence for the United States suggests that this obvious and plausible explanation is in fact correct. Point (3) is not controversial–those radical and Marxist economists who contend that the latest economic crisis is an irreducibly financial one largely agree with it (see, e.g. Duménil and Lévy 2004, Husson 2008, Stockhammer 2009)–so I will limit myself to discussion of the first two points.
Figure 2 depicts movements in two measures of corporations’ rate of profit. The broader measure of profit, which I will call “property income,” is the share of corporations’ output (net value added) that their workers and other employees do not receive, and it is thus much closer to what Marx meant by “surplus-value” than is before-tax profit, the narrower measure of profit. The latter excludes the property income that corporations use to make interest payments and to pay sales tax and similar taxes.
As Figure 2 indicates, both rates of profit rebounded sharply after the Great Depression, and they remained quite high for more than a decade after the end of World War II. In contrast, no substantial rebound followed the slumps of the mid-1970s and early 1980s.
From the mid-1950s to the slump year of 1982, both rates fell substantially, and more or less continually, although the accelerating inflation of the 1970s temporarily reversed the decline. And in the period following 1982, neither rate has experienced a sustained recovery.
Figure 2. Profits as Percentage of Historical Cost of Fixed Assets, U.S. Corporations, 1929-2008
(click to view)
The property-income-based rate of profit has continued to fall; the only significant exception to the general trend is the sharp but brief rise in profitability produced by the asset-price bubble of the last decade. In contrast, the rate of profit in which before-tax profits appear in the numerator did not decline further, but neither did it rebound in a sustained manner. It recovered significantly, but temporarily, during the dot-com bubble of the 1990s. However, it then fell very sharply, so its level during the trough years of 2001-02 was no higher than its level during the 1982 trough. During the asset bubble of the last decade, it skyrocketed again, but then declined rapidly as the economy sank into recession.
The trajectories of these two rates of profit have differed because corporations’ interest payments have fallen as a share of their property income. Interest payments amounted to 20% of property income in 1982, but they then fell, almost continuously, to 0% in the mid-1990s. And they remained very low, or even negative, during much of the last decade.[3] Since corporations paid out less of their property income as interest, they retained a greater share for themselves as before-tax profits. The ratio of before-tax profits to advanced capital therefore remained roughly constant even as the ratio of property income to advanced capital continued to decline.
The relative constancy of the before-tax rate of profit since the early 1980s is therefore not an indication that “neoliberalism” succeeded in halting the fall in surplus-value per dollar of advanced capital. Since property income is a much better proxy for surplus-value than are before-tax profits, and the property-income-based rate of profit continued to fall, the evidence indicates that the fall in surplus-value per dollar of advanced capital was not halted. Corporations were simply able to keep a larger share of the relatively shrinking pool of surplus-value for themselves as the share that they turned over to their creditors declined.
Figure 3 indicates that point (2) of the obvious and plausible explanation is correct–the persistent fall in profitability led to a persistent fall in the rate of accumulation. U.S. corporations’ before-tax rate of profit fell from 24% in 1978 to 12% in 2001, and their rate of accumulation (net investment, valued at historical cost, as a percentage of the historical cost of their fixed assets) fell from 13% in 1979 to 3% in 2003. Thus the rate of accumulation tracked the rate of profit quite closely, in the sense that both rates fell and in the sense that changes in the rate of accumulation followed changes in the rate of profit.
(click to view)
However, the radical and Marxist economists who contend that the rate of profit has recovered substantially since the early 1980s do not accept point (1) of the obvious and plausible explanation. They are proponents of the so-called current-cost (or replacement-cost) “rate of profit,” profit as a percentage of the amount of money that businesses would currently need to replace their capital assets. However, what almost everyone else–businesses, investors, Marx–means by “rate of profit” is the historical-cost rate, profit as a percentage of the amount of money actually invested in the past to purchase the capital assets (their historical cost), minus depreciation. Movements in these two rates have differed substantially since the early 1980s. Whereas, as we saw above, one measure of the historical-cost rate of profit continued to decline and the other experienced no sustained recovery, analogous measures of the current-cost “rate of profit” did rebound to some degree, especially the rate based on before-tax profits (see Figure 4).
Figure 4. Profits as Percentage of Current Cost of Fixed Assets, U.S. Corporations, 1947-2008
(click to view)
.
4. Was There a Specifically Neoliberal “Regime of Accumulation”?
However, the proponents of the current-cost “rate of profit” are left with a serious problem. Because they do not accept point (1) of the obvious and plausible explanation, they also cannot accept point (2). They then have to try to account, somehow, for the extremely curious fact that nothing else–the rate of accumulation, GDP growth, corporate output, compensation of employees, etc.–rebounded in response to the recovery in the “rate of profit.”
Now the most obvious–and, prima facie, the most plausible–way to account for this curious fact is that the current-cost “rate of profit” is just a theoretical construct, a figment of the physicalist imagination.[4] It is not something that capitalists try to maximize nor is it the rate of profit that regulates their investment behavior. (I will return to this issue in the next section of this paper.) It is then no longer surprising that the rate of accumulation has declined even as the current-cost “rate of profit” has risen.
Instead of embracing this obvious and plausible explanation, proponents of the current-cost “rate of profit” imagine that a distinct “neoliberal” “regime of accumulation” emerged in the early 1980s (Husson 2008, Stockhammer 2009). They argue that the rate of accumulation fell, not because of a lack of profit, but because this new regime of accumulation was one in which profits were diverted away from productive investment and into financial markets. And this is the reason why they contend that the latest crisis of capitalism is an irreducibly financial one, rather than a crisis rooted in underlying profitability problems.
For instance, Duménil and Lévy (2004, p. 65) write,
Why was the restoration of the rate of profit not coupled with a parallel resumption of growth …? The key to this enigma may be found in the monetary and financial mechanisms …. [T]he continuing poor performance of the American and European economies with respect to capital accumulation are actually the effect of the specific dynamics of neoliberalism. One can, therefore, assert that the structural crisis is over and blame neoliberalism for poor accumulation rates.
Similarly, Husson (2008) contends that
[the] decrease of the wage-share has allowed a spectacular recovery of the average rate of profit from the mid 1980s.
But … the rate of accumulation has continued to fluctuate around a level lower than that before the crisis. In other words, the drain on wages has not been used to invest more.
… The growing mass of surplus value which has not been accumulated has [to] mainly be distributed in the form of financial revenues, and that is where the source of the process of financialisation is to be found. The difference between the rate of profit and the rate of investment is a good indicator of the degree of financialisation.
If it were in fact true that, during an entire quarter-century of capitalism, the rate of productive accumulation has failed to respond to substantial rise in the rate of profit, it would be extremely peculiar. As Husson (2008) acknowledges, such a disconnect between the rates of profit and accumulation is “more or less unprecedented in the history of capitalism.”
But it just isn’t true. At least, it isn’t true of the last quarter-century of capitalism in the U.S. As Figure 3 showed, the fall in the rate of accumulation closely tracked the fall in the rate of profit from the late 1970s through the early 2000s. As the gaps between the two rates suggest, the average share of before-tax profits devoted to net investment between 1965 and 1978, 44.2%, and the average share devoted to net investment between 1987 and 2001, 43.5%, were very similar. Moreover, if we consider the whole post-World War II period, the average share of before-tax profits devoted to net investment between 1987 and 2008, 37.4%, was slightly greater than the average share devoted to net investment between 1947 and 1978, 36.4%.
The reason why I find no long-term decline in the fraction of profit devoted to productive investment, while proponents of the current-cost “rate of profit” contend that such a decline has occurred, is not that I consider investment figures in which depreciation is valued at historical cost while they consider figures in which it is valued at current cost. When depreciation is valued at current cost, the average shares of before-tax profits devoted to net investment are again quite similar in the 1965-1978 and 1987-2001 periods, 32.7% and 31.6%, respectively. And, just as before, the average share of before-tax profits devoted to net investment between 1987 and 2008, 26.9%, was slightly greater than the average share devoted to net investment between 1947 and 1978, 25.9%. Thus, as Figure 5 shows, the gaps between the current-cost “rate of profit” and the associated rate of accumulation before and after the early 1980s are similar to one another.
(click to view)
It is true that, if one examines only the period since 1980, as Husson does in a recent critique of my empirical work on the rate of profit, one finds a growing gap between the rates of profit and accumulation (see Husson 2009, Graphique 7A, “Taux de profit et taux d’accumulation: Etats-Unis 1980-2008”). As Figures 3 and 5 show, the gap between the rates of profit and accumulation has indeed risen since the early 1980s. But that is only because the gap that existed at that time was abnormally and unsustainably small. It has nothing to do with any distinctive and unprecedented neoliberal “regime of accumulation.”
What happened is this: The rate of profit fell sharply beginning in 1980, while the decline in the rate of accumulation was at first slower and more modest. Consequently, net investment as a percentage of after-tax profits shot up to an average of 117% between 1980 and 1986. Thus, U.S. corporations were investing 17% more of their after-tax profits than the after-tax profits they actually had! That situation clearly could not persist. So the gap between the rates of profit and accumulation that had existed earlier was gradually restored. But through 2001, at least, there was no long-term widening of the gap (see Kliman 2010, part VI for further discussion).[5]
.
5. Why the Current-Cost “Rate of Profit” Isn’t One
In the preceding section of this paper, I rebutted the challenge to point (2) of the obvious and plausible explanation of the relative stagnation and rising indebtedness that set the stage for the latest economic crisis. But what about point (1)? Is it indeed the case that a persistent fall in the rate of profit was an indirect cause of the crisis? After all, the current-cost “rate of profit” has risen, and it is this rate that mainstream Marxist and Sraffian economists have used in order to assess movements in profitability for at least a half-century. It is not merely something that a few of them recently pulled out of the hat in order to justify their claim that the crisis is an irreducibly financial crisis rather than a crisis rooted in profitability problems. Is it really the case that they have all been guilty of an outright error for a half-century or longer?
My answer is an unqualified “yes.” The current-cost rate of profit is simply not a rate of profit in the normal sense of the term.[6]
First of all, the current-cost “rate of profit” is not what businesses and investors seek to maximize. They base their investment decisions on measures of profitability such as net present value (NPV) and internal rates of return (IRR). Whereas the current-cost “rate of profit” values current investment expenditures and future receipts simultaneously, using a single set of prices, NPV and IRR measures use current prices to value current investment expenditures, but use expected future prices to compute future receipts.
Secondly, the current-cost “rate of profit” fails to accurately measure businesses’ and investors’actual rates of return, their profits as a percentage of the original amount invested. Since it uses a single set of prices to current investment expenditures and future receipts, it assumes, in effect, that prices do not change. Thus, if prices rise or fall, the actual rate of return will be higher or lower than the current-cost rate. The discrepancy can be very large even if the change in prices is small.[7]
Thirdly, contrary to what it proponents (e.g., Laibman 1999, p. 223) often claim, the current-cost “rate of profit” fails to accurately measure businesses’ and investors’ expected future rates of return. Imagine a that firm which produces computers invests in new equipment that costs $100,000 at today’s prices, and that the resulting increase in its output of computers, if they are also valued at today’s prices–is $30,000 per annum. The current-cost “rate of profit” on this investment is 30%. But computer prices fall rapidly year after year, so only the most naïve firm would overlook this information and expect a 30% rate of return on its investment instead of something far smaller.
Fourthly, the current-cost “rate of profit” bears no clear relationship to the rate of capital accumulation.[8] Yet this relationship is perhaps the main reason why the rate of profit is of economic importance. It is well known, for instance, that the rate of profit is the maximum rate of accumulation. However, if prices are falling, the current-cost “rate of profit” can exceed the maximum rate of accumulation by a considerable amount (see Kliman 2007, pp. 85-87).
Finally, although Husson (2009) and Duménil (quoted in Kliman 2010a) have recently defended the use of the current-cost rate on the ground that the historical-cost rate of profit is affected by inflation, while the current-cost rate eliminates that effect, the problem is that the current-cost rate adjusts for inflation in an improper manner. What it adjusts for is actually not inflation–a general, economy-wide increase in the price level–but rather increases in the prices of each type of capital asset.
It might make sense to adjust for inflation in this manner if there were no changes in the composition of capital assets over time. In that case, changes in the prices of capital assets acquired in the past would accurately reflect the changes in capital-asset costs that businesses currently face. But when, for instance, businesses were in the process of buying computers instead of replacing their worn-out typewriters, changes in the replacement cost of typewriters became an ever-less meaningful measure of the inflation (or deflation) they experienced. The replacement cost of typewriters became ever-less meaningful even for businesses that continued to use typewriters, because they did not replace the typewriters when they wore out, but bought computers instead. But current-cost measures are, precisely, replacement-cost measures. They measure changes in the cost of replacing the entire current stock of capital assets, which contained a relatively large number of typewriters, not changes in the cost of the capital assets that businesses are actually acquiring currently. The latter contained a relatively large number of computers and relatively few typewriters.
Thus, in order to properly adjust rates of profit so as to remove the effects of inflation, one needs to control for changes in the general price level, not compute the current-cost “rate of profit.” My estimates of inflation-adjusted rates of profit indicate that the movements in such rates since the early 1980s did not diverge substantially from the movements in the unadjusted historical-cost rates of profit that I discussed above. When before-tax profits serve as the numerator of the rate of profit, the inflation-adjusted rate rises only slightly, by about one percentage point, between the trough of 1982 and the trough of the early 2000s. And when property income appears in the numerator, the inflation-adjusted rate of profit continues to decline (see Kliman 2010b, part II, section E, and part V, section D).[9]
.
6. Conclusions
My findings disconfirm the claims that the latest economic crisis is rooted in nothing deeper than financial-sector phenomena that are essentially unrelated to movements in profitability. They therefore fail to lend support to the now-fashionable belief that greater state control over the financial sector will suffice to prevent the recurrence of similar crises in the future.
The mainstream “Marxian economics” tradition is founded on the myth, which has been refuted (see, e.g., Kliman 2007), that Marx’s own value theory is internally inconsistent. Yet the use of current-cost “rates of profit,” a direct consequence of the myth of inconsistency, remains pervasive. Hence this myth lies at the root of the implausible claims that the rate of profit has been heading ever-upward while the economy goes down the tubes, and the fashionable theories that take surface financial-sector phenomena to be essential causes of the latest economic crisis. The record needs to be set straight; the alleged proofs of Marx’s inconsistencies and the “Marxian economics” tradition need to be repudiated.
.
References
Celasun, Oya, and Keim, Geoffrey. 2010. The U.S. Federal Debt Outlook: Reading the Tea Leaves. IMF Working Paper WP/10/62, Washington, DC: International Monetary Fund.
Duménil, Gérard and Lévy, Dominique. 2004. Capital Resurgent: Roots of the Neoliberal Revolution. Cambridge, MA: Harvard University Press.
Herman, Shelby W. et al. 2003. Fixed Assets and Consumer Durable Goods in the United States, 1925-97. U.S. Department of Commerce, Bureau of Economic Analysis. Washington, DC: U.S. Government Printing Office.
Hoover, Herbert. 1952. The Memoirs of Herbert Hoover, Vol. 3: The Great Depression, 1929-1941. New York: Macmillan.
Husson, Michel. 2008. A Systemic Crisis, Both Global and Long-Lasting, Workers’ Liberty website, www.workersliberty.org/story/2008/07/21/marxists-capitalist-crisis-7-michel-husson-systemic-crisis-both-global-and-long-las.
Husson, Michel. 2009. Les Coûts Historiques d’Andrew Kliman. https://nouveaupartianticapitaliste.org/actualite/economie/les-couts-historiques-dandrew-kliman-par-michel-husson-decembre-2009; also at hussonet.free.fr/histokli.pdf.
Kliman, Andrew. 2007. Reclaiming Marx’s “Capital”: A refutation of the myth of inconsistency. Lanham, MD: Lexington Books.
Kliman, Andrew. 2010a. Masters of Words: A reply to Michel Husson on the character of the latest economic crisis. Marxism 21, vol. 7, no. 2, Summer 2010 pp. 39-80.
Kliman, Andrew. 2010b. The Persistent Fall in Profitability Underlying the Current Crisis: New temporalist evidence. New York: Marxist-Humanist Initiative. Available from marxisthumanistinitiative.org.
Laibman, David. 1999. Okishio and His Critics: Historical cost versus replacement cost, Research in Political Economy vol. 17, pp. 207-27.
Marx, Karl. 1989. Karl Marx, Frederick Engels: Collected Works, vol. 32. New York: International Publishers.
Moseley, Fred. 2008. Some Notes on the Crunch and the Crisis, International Socialism no. 119. Available at www.isj.org.uk/index.php4?id=463&issue=119.
Stockhammer, Engelbert. 2009. The Finance-Dominated Accumulation Regime, Income Distribution and the Present Crisis. Department of Economics Working Paper no. 127. Wien, Austria: Vienna University of Economics & Business Administration.
.
Notes
1. Almost all of my data come from official U.S. government sources, especially the Bureau of Economic Analysis, www.bea.gov, and the Federal Reserve System, www.federalreserve.org. Detailed discussions of the sources of most of the data I will present, and my estimation procedures, are provided in Kliman (2010a and 2010b). Additional information will be provided upon request; please write to me, care of mhi@marxisthumanistinitiative.org.
2. The rate of accumulation is the growth rate of the capital that is advanced, i.e., net investment (investment minus depreciation) as a percentage of advanced capital. Since the rate of profit is profit as a percentage of advanced capital, the rate of accumulation is equal, by definition, to the rate of profit times the fraction of profit that is invested. The rate of profit is therefore a key determinant of the rate of accumulation. If the fraction of profit used for investment is roughly constant, the rate of accumulation will rise and fall by roughly the same percentage as the rate of profit. It is therefore reasonable to expect the rate of accumulation to track the rate of profit.
3. These interest-payment figures can be negative because they are “net interest” figures, i.e., interest paid minus interest received.
4. The term physicalism refers to any approach according to which “physical quantities” (technology and real wages) are the sole proximate determinants of relative prices, profits, and the rate of profit. The replacement-cost “rate of profit” is a physically determined rate (see Kliman 2007, chap. 7).
5. Owing to the very sharp increase in before-tax profits in the middle of the last decade, net investment as a percentage of before-tax profits fell markedly. The percentage has since risen, although the severe financial crisis and recession have tended to reduce the magnitude of the rise. It is too early to tell whether a long-term change has taken place in the relationship between net investment and before-tax profits.
6. The U.S. government publishes data for capital stocks in terms of current costs, but its concept of “capital stock” was not developed in order to measure profitability. The measures of net investment upon which it is based are intended to be “rough indicators of whether the corresponding capital stocks have been maintained intact” (Herman et al. 2003, p. M-2).
7. In Kliman (2010b, part V, section B), I work out an example in which an investment project has a very long life and the price of the business’ product falls by 2% per year. If the current-cost “rate of profit” is 10%, the actual rate of return is only 7.8%.
8. I am referring here to the actual accumulation of capital, the increase in advanced capital as measured at historical cost, not the increase in the current cost of capital assets. There is indeed a strict relationship between the current-cost “rate of profit” and net investment as a percentage of the current cost of capital assets.
9. The procedures I used to adjust for inflation were criticized by Husson (2009). In Kliman (2010a), I show that an alternative adjustment procedure of the type he recommends yields empirical results that scarcely differ from those I reported originally.

Your source for mass of profit is the BEA? Among other things, their methodology is largely based on IRS data and is much more to do with accounting procedures than what Marx laid out in Kapital.
Saying that, I must agree that rate of profit has been in long run, tendential, decline – and absolute limits to counter-cyclic policies are quite well being discovered.
Transition has been/is upon us…
Hi Juan,
Yes, the BEA’s profit estimates are based on IRS data, but they try to correct for under-reporting.
I basically use the same data as everyone else, which is helpful when challenging what others do with it.
I don’t say that the BEA data (in raw form) confirm what Marx argued, because I don’t say that they constitute a test of his theory. What I’m trying to do is to *explain* observed phenomena, namely trends in rates of profit in which profits are measured as accountants measure them. I
I do think that Marx’s theory fits the facts remarkably well–but not (just) because observed rates of profit have fallen. Rather, I’ve been able to show (in a book on the underlying causes of the Great Recession that will come out in a few months) that his theory can explain why the rate of profit fell. The key facts are that
(a) employment in U.S. corporations has grown more slowly than their capital accumulation since the end of WWII, which is the relationship that Marx’s theory highlights;
(b) this produces a tendency for the rate of profit to fall;
(c) the tendency will be manifested empirically unless it is offset by
(d) an increase in the ratio of profit to compensation received by employees; and/or
(e) a faster rate of increase in money prices relative to commodities’ real values; but
(f) these potentially offsetting factors did not occur.
So the long-run fall in the observed rate of profit (based on BEA concepts) is almost wholly attributable to slow growth of employment relative to capital accumulation during the last 6 decades.
Andrew, whilst I’m sympathetic to the issue of the fall in the rate of profit being important today, I’m not entirely sure that the current crisis is all to do with the problem of producing surplus value. I think there may also be an issue to do with realising surplus value. My latest blog tries to disentangle the abstract cyclical crisis from the falling rate of profit. It’s not a long article. If you have time I’ll be grateful for your comments.
Hi duvinrouge,
A relative decline in production of surplus-value will lead, ceteris paribus, to a relative decline in the conversion of surplus-value into the form of money (“realization” of it). So the question is whether there’s a realization problem that’s *independent* of the problem of surplus-value production.
If one focuses on *immediate* causes, the answer seems clearly to be “yes.” Stuff containing surplus-value is produced, but investment demand suddenly falls. At the same time, there are layoffs, so consumption demand also falls. Too much has been produced relative to the new level of investment + consumption demand.
You seem to be referring to such immediate causes when you talk about cyclical crisis, as in the 2d paragraph of your article:
“A cyclical crisis is just over-production. An overproduction of commodities relative to the commodity that acts as the universal equivalent – money. In otherwords, production runs ahead of the market. There is a problem realising surplus value. As the law of value asserts itself commodity production falls, i.e. there’s a recession.”
In contrast, my article above is focused on *longer-term, underlying* causes.
Moreover, and this is my key point, even though the *immediate* cause of a crisis may be inadequate realization of surplus-value, not inadequate production of surplus-value, this doesn’t contradict the idea that inadequate production of surplus-value is a *longer-term, underlying* cause of the downturn in the economy. A fall in the rate of profit (due to production of surplus-value that’s inadequate in relationship to the volume of capital advanced) can (and I believe has) led to slower capital accumulation, slower growth, and rising debt burdens, and this combination of factors can (and I believe has) led to a situation in which a financial crisis triggers a persistent slump in the whole economy long after the financial crisis is resolved.
So I completely agree with you that “when Marx talks about the tendential fall in the rate of profit in Volume III of Capital, he isn’t refering to the cyclical crises but the long term trend that capitalism faces.” However, your comment above,
“whilst I’m sympathetic to the issue of the fall in the rate of profit being important today, I’m not entirely sure that the current crisis is all to do with the problem of producing surplus value. I think there may also be an issue to do with realising surplus value”
seems to put the long-term trend in a separate compartment from the immediate causes of crisis. I don’t think they’re separate. I think the “issue to do with realising surplus value” has a lot “to do with the problem of producing surplus value.”
Just one more comment on your article: the sharp rise in energy prices during the 2000s seems to me to be largely an effect of the artificial boom of that decade rather than an independent cause. That’s partly because the boom seems to have started before the price increases, and partly because the price increases were largely demand-driven (they came down markedly during the recession).
Andrew,
Many thanks for your response.
Whilst I think we can agree that its unlikely that the problem of realising SV is the *main* cause of the current crisis, empirically it’s probablly difficult to show that the current crisis is either *entirely* due to the problem of producing SV, or *mostly* due to the problem of producing SV.
But whether entirely or mostly, does it not mean that capitalism cannot quickly recover?
That politics will continue to catch up with economics.
We live in interesting times!
Hi duvinrouge,
Assume that inadequate production of surplus-value causes inadequate realization of surplus-value, which in turn causes a downturn.
Then inadequate production of surplus-value is obviously not the exclusive cause.
If, by “main cause,” one means something like “quantitatively most significant cause,” I don’t think it’s meaningful to speak of a “main cause” here, because the two causes aren’t separate things. One’s the effect of the other. … Someone inherits $100,000, bets it, and ends up with $1,000,000. Is the “main cause” the fact that they won the bet, just because winning the bet is responsible for $900,000 of the $1,000,000? Or is it the inheritance, without which they’d have $0?
In a book that will be published next month, I make the argument I made above (and provide the data): a fall in the rate of profit led to slower capital accumulation, which led to slower growth, which led to rising debt burdens, and this combination of factors led to a situation in which a financial crisis triggered a persistent slump in the whole economy long after the financial crisis was resolved.
One might argue that there were other factors. That’s obviously so, but it doesn’t contradict the argument above. One might argue that some or all of the causes mentioned above were not quantitatively significant causes of the next cause in the chain. I tried to deal with that issue as best as I could. I admit that conclusive proof is lacking, but I think the evidence for some of the links is extremely persuasive. For instance, changes in the rate of profit *precede* changes in the rate of accumulation, and changes in the rate of profit account for 83% of the changes in the rate of accumulation since 1970.
The weakest link, I think, seems to be the one between slow growth and falling profitability on the one hand, and rising debt burdens on the other. There were other causes of rising debt burdens that were quantitatively very significant–e.g., a regulatory environment that allowed lots of financial-sector leverage, Fed “easy-money” policy in the early 2000s, etc. I in effect argue that such things were intermediate causes in the chain, responses to the frailty of the economy caused by falling rates of profit, accumulation, and growth. I.e., that they were largely efforts to prop up the economy and head off a drastic downturn or long-term stagnation. In the case of the easy-money policy of the 2000s, I think the evidence is very strong. In other cases, not so strong.
I don’t think capitalism will quickly recover, but the reason I think that’s the case is that not enough capital value has yet been destroyed to allow for a quick recovery. This is a rather common view, BTW–for instance, Kenneth Rogoff, who’s ex-IMF and coauthor of a well-known book that argues that the latest crisis is a classic banking crisis (_This Time is Different_) has the same view. Anyone who says that a lot more “deleveraging” is needed is saying the same thing, too.
I don’t think inadequate demand (realization of surplus-value) is ever a prime mover. It’s a cause in the chain of causes that’s fairly far down the chain. For instance, it seems pretty clear that the debt overhang is currently a main cause of sluggish demand, both investment demand and consumption demand.
Sorry to go on so long, but I don’t see how the broad issues you raise can be dealt with adequately in a brief way.