
by Andrew Kliman
According to a narrative that is quite popular in anti-neoliberal “left” circles and among “populist” liberals, Donald Trump won the 2016 US presidential election because of an uprising of the “white working class” against a rapacious neoliberalism that has caused its income to stagnate for decades.[1] Part V of Marxist-Humanist Initiative’s 2018 Perspectives has presented a wealth of evidence, of various types, that exposes the factual flaws in this narrative. In this article, I will present additional evidence, from the 2016 American National Election Study, on the attitudes and political positions of a key demographic, the “Obama-Trump” voters, also known as the voters who “flipped” to Trump––that is, people who voted for the Democrat (Obama) in 2012 but the Republican (Trump) in 2016.
The evidence does not support the claim that their vote for Trump constituted a rejection of neoliberal ideology or policy. The responses that Obama-Trump voters volunteered to a pre-election question on why they might vote for Trump provide very little evidence that their vote for him was based either on opposition to neoliberal economics or a preference for social-democratic programs. And their responses to dozens of other survey questions were markedly different from, and much to the right of, the responses provided by non-Trump voters (almost 90% of whom voted for Hillary Clinton). With respect to several key factors––immigration, authoritarianism, and attitudes to blacks, women, and Hispanics––their responses were far closer to those of other Trump voters, and often even further to the right.
Section 1 of this article discusses the place of Obama-Trump voters within the “imaginary” of the anti-neoliberal “left.” Section 2 briefly reviews what has already been shown to call into question the anti-neoliberal “left” story that Trump won the election because working-class voters rebelled against the economic distress that neoliberalism had inflicted on them. Section 3 situates the present study in relation to what is already known; it also provides details about data and computations. Section 4 discusses the demographic characteristics of Obama-Trump, other Trump, and non-Trump voters, with special emphasis on economic characteristics. Section 5 presents and analyzes the information that Obama-Trump voters volunteered, before the election, on why they might vote for Trump. Section 6 compares and contrasts the attitudes of Obama-Trump and other voters: to Obama and the Democratic Party; to social spending and social programs; to immigrants and immigration; to questions pertaining to authoritarianism; to blacks, women, Hispanics, and Muslims; and to international affairs. Section 7 provides a summary and conclusions.
1. Obama-Trump Voters and the Anti-Neoliberal “Left”
There were a lot of Obama-Trump voters. According to the high-end estimate, there were 9.2 million of them (6.7% of all voters); the low-end estimate is 6.0 million (4.4% of all voters).[2]
The main reason Obama-Trump voters command a lot of attention is, of course, that Trump’s Electoral College victory is largely attributable to their “defection” from the Democrats. Although some of the decline in Hillary Clinton’s share of the vote (48.2%) compared to Obama in 2012 (51.0%) was due to Obama voters who stayed home in 2016 or voted for a third-party candidate, it has been estimated that about 70% of the decline was due to Obama voters who flipped to Trump.
Yet the anti-neoliberal “left” has different reasons for fixating on the Obama-Trump phenomenon. It trots out the flip to Trump as evidence that a significant segment of working-class voters is in rebellion against the “economic distress” or “economic hardship” that neoliberalism inflicted on them. Last year, for instance, Sarah Jaffe wrote in the social-democratic journal Dissent that
Thomas Frank has been … calling repeatedly for the Democratic Party to return to … the economic liberalism that built the American middle class. Ignoring the economic needs of working people, Frank has written time and again, would lead to disaster.
In 2016 disaster arrived. Parts of the working class bit back, repaying decades of neglect with a vote for Trump ….
Furthermore, the flip from Obama to Trump is construed by many on the anti-neoliberal “left” as knock-down evidence that Trump won because he put forward an economic populist message, not because of his racism. After all, Obama is black, and these people voted for him, so how could racism be a motivating factor in their flip to Trump?!
This bit of casual empiricism––also invoked by mainstream election analysts like Nate Cohn and conservatives like Musa al-Gharbi––ignores the fact that Trump made racial animus and white supremacy central to his campaign, in marked contrast to John McCain and Mitt Romney, the Republican candidates in 2008 and 2012. As Jamelle Bouie and others have pointed out, it is quite possible that a large share of Obama-Trump voters were willing to vote for Obama when race was not a salient election issue, but lined up behind white supremacy when the prospect of its triumphant restoration became a serious possibility. This latter hypothesis is consonant with the data I will present below.
But most of the anti-neoliberal “left” is not interested merely in the past. Its aim is not just to tell centrist Democrats, progressives, and leftists “we told you so.” Its interest in the Obama-Trump voters is bound up with its drive for political power. As Marxist-Humanist Initiative stated in our 2018 Perspectives (p. 45 of online version; p. 61 of pamphlet version):
[The] overall orientation [of the anti-neoliberal “left”] can be called “Left First.” Its primary concern is to “build the left” and win victories––elections, campaigns, adherents, power––for itself. Accordingly, it regards common people as a “constituency” to win over in its quest for political power. And it seemingly has no compunction about winning them over by “meet[ing] them where they are at.”[3] Thus, it offers an alternative version of “populism” that (it hopes) the authoritarian white-nationalist base that supports Trump, Le Pen, et al. will find appealing.
The Obama-Trump voters are critical to this strategy because they are a key “constituency” that the Left-First types imagine they can win over to left-populism.[4] For example, the day after the 2016 election, Naomi Klein opined that “neoliberalism … is no match for Trump-style extremism,” but she assured her readers that “[a] good chunk of Trump’s support could be peeled away if there were a genuine redistributive agenda on the table.” And writing in Jacobin last September, Josh Mound was even more upbeat, assuring his readers that, if the Democrats were to “make a real commitment to confronting income stagnation, rising inequality, and the increasing power of the rich in American politics,” they “would [!] … win back many of the working-class whites who flipped from Obama to Trump.”
2. What Has Already been Shown
The anti-neoliberal “left” story––that Trump won the election because working-class voters rebelled against the economic distress that neoliberalism had inflicted on them––was challenged in Part V of Marxist-Humanist Initiative’s 2018 Perspectives in three different ways:
First, it showed that when income is measured in a reasonable way, the income of the working class did not stagnate under neoliberalism. The Perspectives discussed the fact that even Thomas Piketty (author of Capital in the Twenty-first Century) and his colleagues recognize that it grew substantially. In December 2016, they published a paper containing estimates of after-tax income (per person; adjusted to remove the effects of inflation). Between 1982 and 2014, the income of the bottom 90% of the population increased by 45%, and even the income of the bottom half of the population rose by 31%. For the middle 40%, the increase was 53%.[5]
Second, by means of an examination of the presidential campaigns of George Wallace, the Perspectives showed that Trumpism is not a response to neoliberalism or economic distress; it is a pre-existing condition. Wallace––a long-time authoritarian, racist, right-wing governor of Alabama––ran for president several times in the 1960s and early 1970s, before neoliberalism, globalization, and financialization came along and allegedly pummeled the working class. The messages and authoritarianism of his campaigns were eerily similar to Trump’s. And, like Trump, he garnered surprisingly strong support, not only in the South, but in the North as well, particularly in the industrial Midwest that “flipped” to Trump in 2016. In 1972, for example, he won the Democratic primaries in Michigan––where he received an absolute majority––and Maryland, and he placed second in Pennsylvania and Wisconsin, as well as Indiana, West Virginia, New Mexico, and Oregon.
Third, the Perspectives reviewed a substantial and growing body of research that finds no support for the claim that the economic distress of whites without college degrees––the so-called white “working class”––explains why Trump received an unusually large share of their votes or won the election. Studies that control for the influence of other variables have invariably found that, once such variables are included in the analysis, there is no evidence that the shift to Trump was a revolt of low-income voters or people exposed to competition from imports or immigrant workers. If anything, economic distress made people more likely to vote for Trump’s main opponent. There is no evidence that Trump’s Electoral College victory was a revolt of low-income voters or people exposed to competition from imports or immigrant workers. Instead, it seems to have been due to some combination of racism, sexism, discontent with cultural change, anti-immigrant sentiment, and authoritarianism.[6]
3. The Present Study
The present article supplements this last body of evidence. But instead of isolating the variables that “predict” a vote for Trump, by means of complex statistical analyses that are difficult for non-specialists to interpret, it does something simpler and more readily understandable. It uses the election survey data to paint a portrait, so to speak, of Obama-Trump voters––their demographic characteristics, their attitudes and political positions with respect to key issues, and their expressed reasons for voting for Trump.
This approach cannot identify the causes of Trump’s Electoral College victory. Nonetheless, the evidence to be presented in this article does indicate strongly that the revolt-against-neoliberalism narrative is wrong, for three reasons. First, it presents clear evidence that Obama-Trump voters did not suffer from more economic distress than non-Trump voters. Second, it shows that their stated reasons for voting for Trump have almost nothing to do with neoliberalism or “economic distress,” and that their positions on healthcare and social spending are, on average, well to the right of non-Trump voters. Third, it reveals a significant degree of affinity between Obama-Trump voters’ attitudes and Trump’s pronouncements and behavior, with respect to immigration, authoritarianism, women, blacks, and other minorities. It thereby enhances the plausibility of other studies’ findings that variables pertaining to racism, sexism, authoritarianism, and so forth, but not economic-distress variables, are what “predict” Trump’s Electoral College victory.
There have been a few other empirical investigations specifically about Obama-Trump voters (see Cohn, Drutman, McElwee, et al., and Milbank). My findings are broadly consistent with them, especially my findings that Obama-Trump voters are much to the right of non-Trump voters, and much more racist and anti-immigrant. As Dana Milbank put it, summarizing a study done by the AFL-CIO’s Michael Podhorzer, “Obama voters who did switch to Trump were largely Republican voters to start with. The aberration wasn’t their votes for Trump but their votes for Obama.”
However, the present study is distinctive in two respects. First, it reports on many more demographic and attitudinal variables––more than six dozen. Second, it is not based solely on responses to multiple-choice questions; it also reports on and analyzes answers volunteered in response to an open-ended question (on why the respondent might vote for Trump), and it thereby gives us some insight into how Obama-Trump voters themselves understood their vote choice.
This study uses data from the 2016 American National Election Study (ANES). The data include both responses to questions asked shortly before the November 2016 election and responses to (different) questions asked soon after the election. The study’s sample size (2778 positive-weighted respondents who voted) is smaller than that of other 2016 election studies, but I chose to use it because it asks many more questions of relevance, and thus allows me to provide a much fuller profile of Obama-Trump voters.
It bears repeating that the Obama-Trump voters in the sample are self-reported––people who said (in 2016) that they voted for Obama in 2012 and Trump in 2016. It is very likely that non-trivial numbers of them either did not vote for Obama or did not vote for Trump (see note 2). This is a major problem if one’s goal is to estimate the size of the Obama-Trump vote. Here, however, my main goal is to learn about the attitudes of Obama-Trump voters.
In this context, the main potential problem that misreporting creates is bias; that is, attitudinal differences between self-reported Obama-Trump voters and other voters will be larger or smaller than the attitudinal differences between genuine Obama-Trump voters and other voters. The results will be biased only to the extent that the attitudes of people who incorrectly identified themselves as Obama-Trump voters differ from the attitudes of actual ones. It seems plausible that the errors cancel out, to some extent, for the following reason. Romney voters who claim to have voted for Obama are likely to be attitudinally more similar to Trump voters than genuine Obama-Trump voters are; while Clinton voters who claim to have voted for Trump are likely to be attitudinally more similar to non-Trump voters than genuine Obama-Trump voters are.
The number of (self-reported) Obama-Trump voters in the ANES sample is only 154, but since the differences between their responses and those of non-Trump voters are so great, they are statistically significant, in almost every case, at the 5% level and, in the vast majority of cases, at the 0.1% level (P-values are two-sided). This means that, if there were actually no difference between these two groups in the population as a whole, the chance that the difference in the sample would be as large as or larger than the one reported here is less than one-in-twenty (5%) or less than one-in-a-thousand (0.1%).
The ANES sample is not strictly random, and thus the responses must be weighted, in order to produce an outcome more reflective of the population as a whole. I used the study’s post-election weights, which is ANES’s recommendation for studies such as mine that analyze both pre- and post-election data. The results reported below refer to the weighted responses,[7] and my tests of statistical significance also take into account that the data are weighted.[8]
To assess the degree of dissimilarity between Obama-Trump voters and non-Trump voters, the tables below report a “relative distance” measure for each demographic trait and attitudinal variable––the difference between the figures for Obama-Trump and non-Trump voters as a percentage of the difference between the figures for other Trump voters and non-Trump voters. For example, if 80% of other Trump voters, 65% of Obama-Trump voters, and 20% of non-Trump voters agreed with a particular statement, the relative distance is 75% (= {[65% – 20%]/[80% – 20%]} × 100%). The larger the relative distance, the more dissimilar Obama-Trump and non-Trump voters are. A relative distance of 0% means that Obama-Trump and non-Trump voters are the same in a certain respect; a relative distance of 100% means that Obama-Trump voters are just as dissimilar from non-Trump voters as other Trump voters are; and a relative distance greater than 100% means that Obama-Trump voters are even more dissimilar from non-Trump voters than other Trump voters are.[9]
Unless otherwise indicated, the percentages I report in connection with attitudinal questions are the percentages of people who responded affirmatively to the questions as formulated in the tables, and they add together both strong and weaker affirmative responses (e.g., “agree strongly” and “agree somewhat”). Some of the questions I present as binary options (e.g., “Blacks are more lazy than hard-working”) asked respondents to express their view in terms of a scale in which these options were the endpoints. In these cases, the percentages I report are for the first option, and they include everyone whose response was closer to it than to the other option.
4. Demographic Characteristics
General Characteristics
One of the most well-known facts about the 2016 election is the fact that “non-college” voters (those without at least a four-year college degree) shifted markedly toward Trump; he received a much larger share of their vote than Republican presidential candidates had received in 2008 and 2012. Accordingly, the most striking demographic statistics reported in Table 1 are those pertaining to educational attainment. Not only were non-college voters a much larger share of the other Trump vote (67%) than of the non-Trump vote (57%); they were an even larger share of the Obama-Trump vote (79%). The ANES data also indicate that 7.5% of non-college voters were Obama voters who flipped to Trump, more than double the share of voters with college degrees who flipped (3.4%).
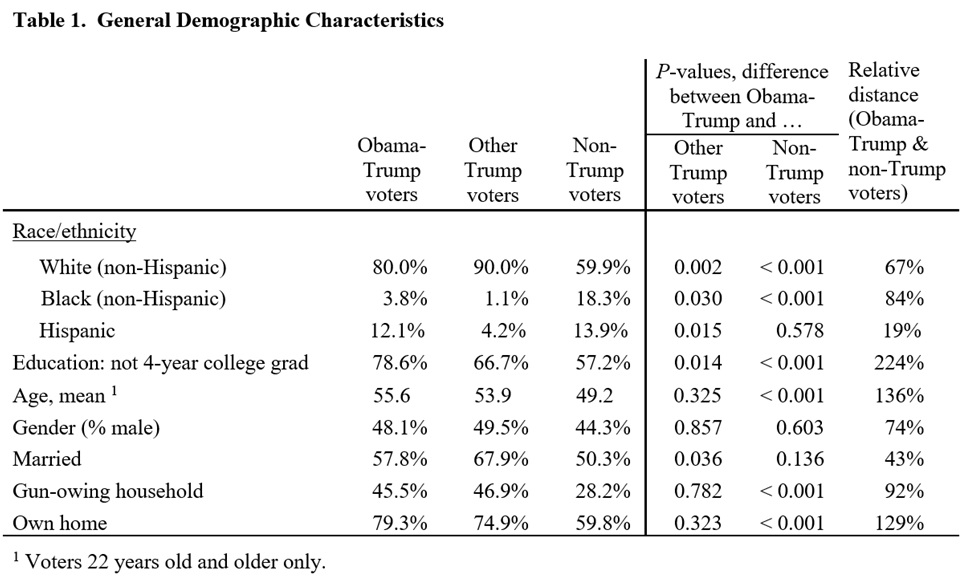
Table 1 also indicates that non-Hispanic whites were a much greater share of Obama-Trump voters than of non-Trump voters, and that fewer than 4% of Obama-Trump voters were black. However, the racial-composition gap between Obama-Trump and non-Trump voters was considerably smaller than the gap between other Trump voters and non-Trump voters, and roughly equal shares of Obama-Trump and non-Trump voters were Hispanic.
The Trump vote was disproportionately male, and this may have been true, to a lesser extent, of the Obama-Trump vote. However, the differences between the male share of the Obama-Trump vote and the male share of the other groups are far from being statistically significant by conventional standards (SSCS).
Married people were a smaller share of Obama-Trump voters than of other Trump voters. They seem to have been a larger share of Obama-Trump voters than of non-Trump voters, but this difference is not SSCS.
Almost half of both Obama-Trump and other Trump voters lived in gun-owing households, while fewer than 30% of non-Trump voters lived in such a household. Almost four-fifths of Obama-Trump voters owned their own home (including those with outstanding mortgages). That share was only a bit greater than the share of homeowners among other Trump voters, but considerably greater than the three-fifths of non-Trump voters who owned their home. The home-ownership data suggest that the Obama-Trump vote, like the other Trump vote, was disproportionately non-urban.
In contrast to other voters, no Obama-Trump voters were younger than 22, because people younger than 22 in 2016 would have been younger than 18 in 2012 and thus unable to vote for Obama. To permit an apples-to-apples age comparison, the following age data pertain only to people at least 22 years old: other Trump voters were almost five years older than non-Trump voters, on average, and Obama-Trump voters seem to have been even older––almost 6 ½ years older than non-Trump voters.[10] However, the age difference between Obama-Trump and other Trump voters is not SSCS.
Economic Characteristics
The data for the total sample indicate than the mean and median (middle) income of Obama-Trump voters were substantially less than the mean and median income of both other Trump and non-Trump voters.[11] Yet the total-sample data are extremely misleading in this case, because they lump together people of different ages, and income levels vary considerably over the course of an individual’s “life cycle.”
As noted above, Obama-Trump voters were, on average, a good deal older than non-Trump voters. Even more striking are the differences between the shares of the groups who were seniors (people 65 years and older). Only 18% of non-Trump voters were seniors, but 31% of Obama-Trump voters were. (About 25% of other Trump voters were seniors.) This has a great effect on the total-sample income data, because the “money income” of seniors is much smaller than that of younger people. US Census Bureau data for 2016 (see Table 1, here) indicate that the median money income of households headed by a senior was only 60% as great as the median for other households.[12]
To permit a meaningful, apples-to-apples, income comparison, we have to eliminate this life-cycle effect. The income figures in Table 2 are therefore for people between 25 and 64 years old only. (Income data for people younger than 25 are dicey, because so many of them are full-time students, live with parents, etc.)
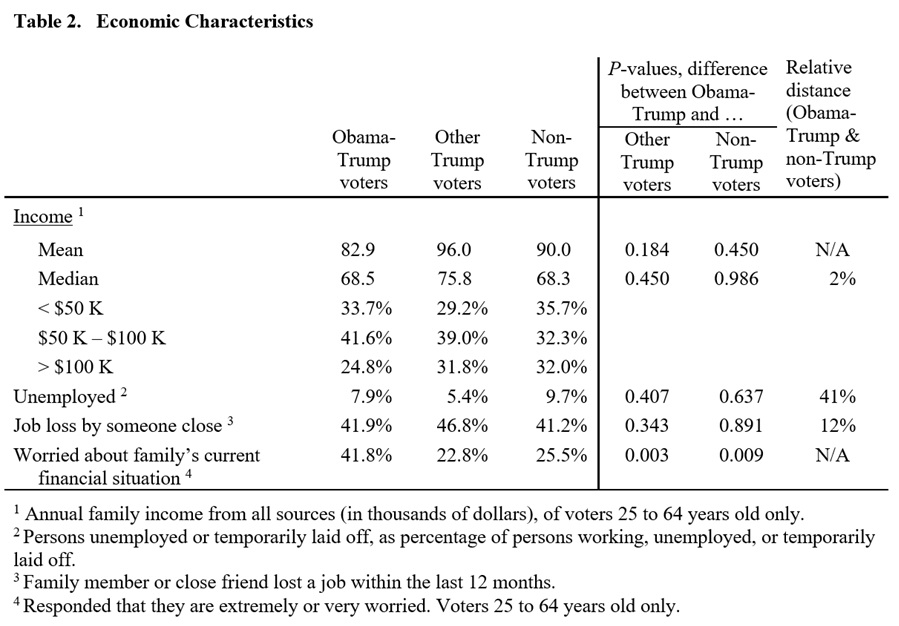
Once we have eliminated the life-cycle effect, the difference between Obama-Trump and non-Trump voters’ median income disappears completely. The mean income of Obama-Trump voters is still about 9% less than the mean income of non-Trump voters. But this is not evidence of economic distress. The mean is lower because relatively few Obama-Trump voters lived in high-income households (more than $100,000 annually), not because a disproportionate share of them lived in low-income households (less than $50,000 annually). The estimated percentage of Obama-Trump voters who were low-income is roughly the same as, and a bit smaller than, the estimated percentage of low-income non-Trump voters.
When the income comparison is restricted to people between 25 and 64 years old, other Trump voters remain better off than Obama-Trump and non-Trump voters. However, the relative differences between their incomes are reduced considerably, and the remaining differences are not SSCS.
Data on voters’ other economic characteristics also fail to provide evidence that Obama-Trump voters were more likely than non-Trump voters to suffer economic hardship. Relatively fewer Obama-Trump voters than non-Trump voters described themselves as unemployed or temporarily laid-off (the difference is not SSCS).[13] And almost identical percentages of Obama-Trump and non-Trump voters said that a family member or close friend had lost a job during the past year.
The percentage of Obama-Trump voters who said that they were extremely or very worried about their family’s current financial situation is much larger than corresponding share of non-Trump voters. In the total sample, 30.9% of Obama-Trump voters, but only 22.1% of non-Trump voters, responded in this manner. Since the median-income gap between Obama-Trump and non-Trump voters disappears when we consider only 25-to-64 year olds, it is reasonable to expect that this restriction will also cause the financial-worry gap to disappear, or at least become smaller. Yet the financial-worry gap actually becomes a good deal larger: 41.8% of Obama-Trump voters, but only 25.5% of non-Trump voters, between the ages of 25 and 64 said that they were extremely or very worried about their family’s financial situation.
Significance of the Findings about “Economic Hardship” and “Economic Anxiety”
Unfortunately, many writers have decided to rechristen “non-college” people––those without four-year college degrees––as working-class, which gave rise to the idea that Trump supporters were disproportionately working class. From there, it was one short step to the inference that they disproportionately suffered from economic hardship, one more short step to the inference that neoliberalism had inflicted this hardship on them, and a final short step to the inference that the working class flipped to Trump in an act of rebellion against neoliberalism.
The data presented above call a halt to this slippery slope of unwarranted inferences. Non-college voters were indeed an exceptionally large component of the Obama-Trump vote, even larger than the non-college component of Trump voters overall. But none of the various possible measures of economic hardship considered above––low median income, a high share of low-income people, a high unemployment rate, and job loss among family members and close friends––indicate that the voters who flipped to Trump experienced more economic hardship than people who voted for Clinton or other candidates. Hence, the data fail to support the claim that the flip to Trump is attributable to personally-experienced economic hardship. Much less do they lend support to the rebellion-against-neoliberalism story.
Despite the lack of evidence that Obama-Trump voters personally experienced more economic hardship than non-Trump voters, they expressed a much greater degree of economic anxiety––that is, the percentage who said that they were extremely or very worried about their family’s current financial situation was much larger. When it comes to understanding Trump’s support, this difference between economic hardship and economic anxiety cannot be stressed enough. There is clear evidence, here and in other studies, that Trump voters experienced relatively high levels of economic anxiety. This has been construed as evidence that they also disproportionately faced economic hardship. But the evidence, here and elsewhere, indicates clearly that they did not. Economic hardship and economic anxiety are simply two different things and, in the case of Trump voters, they do not go hand-in-hand.
Why did Obama-Trump voters express disproportionate financial worry even though they did not suffer from disproportionate economic hardship? They may have been lying, or they may have worry-wart personalities, or they may have been importing fears about their future financial situation into their responses to a question about their current situation. However, the most plausible explanation seems to me to be that expressed economic anxiety is actually an effect, not a cause, of dissatisfaction with the status quo. Trump-Obama voters had other reasons for disliking the status quo under Barack Obama, and their answer to the financial-worry question was a performative act, a way of expressing their dislike. A similar statistic, the Gallup Organization’s economic confidence index, provides striking support for the idea that general dissatisfaction with the status quo causes “anxiety” about future economic conditions, not vice-versa. Between 2016, when Obama was president, and 2017, when Trump took office, Republicans’ economic confidence rose by 80 points (out of a possible 200), from –33 to 47, while Democrats’ economic confidence fell by 37 points, from 16 to –21. This reversal was due entirely to a reversal in assessments of future economic conditions rather than current ones.
5. Why They Voted for Trump: What Obama-Trump Voters Volunteered
Writing in Jacobin shortly before the 2016 election, Seth Ackerman, a soft-on-Trump “leftist,” objected to statistical studies that infer Trump voters’ motivations from attitudinal variables––such as those that are indicative of racial resentment––that distinguish Trump voters from other voters (i.e., “predict” a vote for Trump). The basis of his objection is far from clear; Ackerman questioned the assumption that “individual motivations … can be inferred from group differences” in attitudes, but he provided no argument against that assumption.[14]
Be that as it may, I have chosen to address his objection by looking at data that link Obama-Trump voters’ motivations to their votes. Prior to the election, ANES asked respondents whether there was “anything in particular about Donald Trump that might make you want to vote for him?” If they said yes, they were asked “what is that?,” and prompted to provide additional particulars until they indicated that there were no more. These responses provide direct evidence of voters’ motivations. Without having to choose among options selected for them, and in their own words, voters voluntarily specified the particular factors that made them want to vote for Trump.
Of the 154 respondents who ultimately did vote for Trump, 120 (more than three-fourths) volunteered responses to this question. All of the responses appear in Table 3, exactly as they are recorded in the ANES data file––I have not corrected any of the many misspellings, grammatical errors, and so forth. Table 3 groups the responses into categories, which are arranged from most prevalent to least prevalent. In a relatively small number of cases, respondents gave more than one reason why they might vote for Trump. In these cases, I have disregarded generalities and have classified responses according to their predominant thrust (when possible) or according to their first specific reason. (Of course, the categories, as well as the assignment of responses to them, are judgment calls; other people might legitimately classify the responses in a somewhat different way than I have.)
Click here for Table 3 (PDF format)
Analysis of the volunteered responses
With respect to the key issue with which this article is concerned––whether the flip of some voters from Obama to Trump can properly be understood as revolt against economic distress inflicted by neoliberalism––the most striking feature of Table 3 is the almost-complete lack of responses that can be construed as anti-neoliberal. None of the reasons that Obama-Trump voters gave for voting for Trump referred to income inequality, or globalization, or precarity, or unrestrained markets––except, perhaps, the response of one voter who favored Trump because “[h]e is less socialist” (emphasis added). And none of them mentioned welfare-state issues, not even Trump’s promises to protect the Social Security and Medicare programs.
“Jobs” were mentioned, but in only 4% of all cases (5 out of 120), and in only one of these cases was it a stand-alone response. In the other four cases, it followed references to immigration, to patriotism and security, and to corruption and security; or it preceded references to trade policy, security, and Hillary Clinton.[15]
Indeed, very few responses mentioned economic matters at all. I was able to classify only nine of the responses (8%) as economic, and only two of these can plausibly be construed as providing even a hint of dissatisfaction with neoliberalism––those that referred to “Jobs in America” and “bring[ing] jobs back to American.” Three lauded Trump’s alleged fiscal responsibility and/or ability to stabilize the economy; two indicated that Trump was good for business or industry; one was unspecific (“ecomony”); and the remaining one was the “less socialist” comment.
Relatively few responses (30%) were issue- or policy-oriented. Instead, almost half of the responses (48%) focused on Trump as a person––his personality, his business background and/or wealth, and the fact that he was not a politician. (The framing of the question respondents were asked, which used the words “anything in particular about Donald Trump,” may have induced some of the focus on Trump as a person.) The remaining responses (23%) expressed a desire for change, a dislike of Clinton, a belief that Trump would be good “for America” or “the people,” or they focused on other matters.
The 30% of Obama-Trump voters who did refer to issues and policies were attracted, above all, by Trump’s anti-immigration views and promises. Thirteen percent of the responses focused on immigration. Another 10% focused on standard “culture-war” issues of the American right: gun-owners’ rights, support for police and a strong military, opposition to abortion, God, and “family values and man woman relationships.” The remaining issue-oriented responses were the economic ones.
There are strong indications of authoritarian attitudes in some of the responses. For example, many of the responses that pointed to Trump’s personality were about him being a “strong person,” “tough,” “agressive,” firm, strong-willed, “action-oriented,” “blunt,” “straight forward,” and a “a no nonsense man.” There are also several references to strength and toughness in connection with immigration and with fighting against terrorism. And a couple of the responses that focused on Trump’s business background explicitly expressed the voter’s wish that the country be run like a business. This is evidence of authoritarianism because, next to the military and the police, businesses are the most authoritarian institution in the country.
In contrast, the responses do not indicate that Obama-Trump voters are misogynistic; nor do they reveal much racism, with a couple of the comments about immigration being notable exceptions. However, while the paucity of anti-neoliberal comments among Obama-Trump voters is valid evidence of the lack of anti-neoliberal sentiment among them, it would be wrong to conclude that the paucity of misogynistic and racist comments accurately reflects Obama-Trump voters’ attitudes. There is an important difference between these two cases: it is much more socially acceptable to openly express anti-neoliberal attitudes than to openly express misogynistic and racist ones, especially when one is volunteering one’s views instead of revealing them through responses to multiple-choice questions. Indeed, Obama-Trump voters’ responses to multiple-choice questions about their attitudes, which will be discussed presently, provide clear evidence of misogyny and racism.
6. Obama-Trump Voters’ Attitudes
Some Obama-Trump voters may have flipped to Trump because they disliked something particular about the 2016 Democratic candidate; 10% of the volunteered responses discussed above do make reference to the voter’s dislike of Hillary Clinton (alone or together with other factors). Yet Obama-Trump voters’ lack of affinity with the Democratic Party extended beyond the candidate it put up in 2016.
Attitudes toward Obama and the Democratic Party
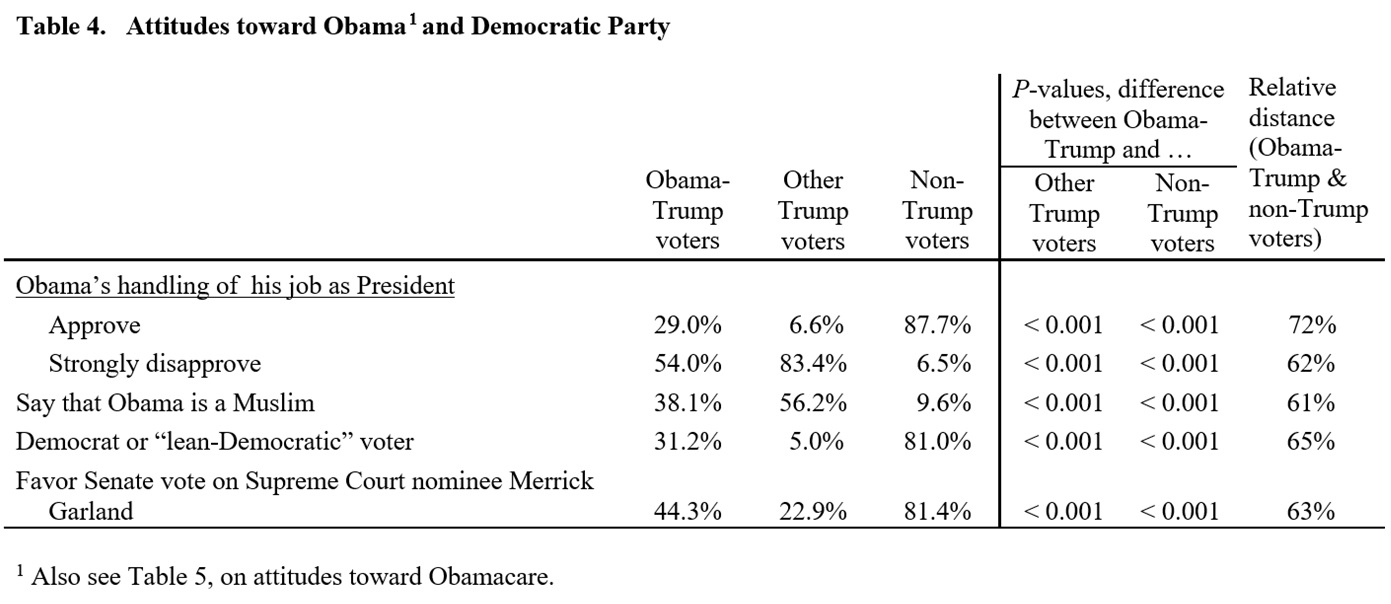
Table 4 shows that only 29% of Obama-Trump voters approved of Obama––whom they had voted for in the previous election––that 54% of them strongly disapproved of him, and that 38% of them even said that Obama is a Muslim. Only 31% identified themselves as Democrats or closer to the Democratic Party than to the Republican Party. And when asked before the election whether the Senate should hold a vote on Obama’s nominee to the Supreme Court, Merrick Garland, whom Republicans were refusing to consider, 81% of non-Trump voters, but only 44% of Obama-Trump voters, said that it should. In all these cases, Obama-Trump voters’ attitudes were closer to those of other Trump voters than to non-Trump voters. On average, the relative distance for the variables in this table is 65%, which means that Obama-Trump voters’ attitudes were only about half as far away from those of other Trump voters as they were from those of non-Trump voters.
Attitudes toward Social Spending and Social Programs
Furthermore, the data presented in Table 5 fail to support the idea that most Obama-Trump voters are ready and waiting to be won over by Left-First types wielding a “make social democracy great again” message. Only 33% of Obama-Trump voters (but 55% of non-Trump voters) favored the provision of more government services, and only 13% of Obama-Trump voters (but 29% of non-Trump voters) favored an increase in federal government welfare spending. Of course, the term “welfare” has distinctly racial connotations, but the gap between the attitudes of Obama-Trump and non-Trump voters was pretty much the same (40% versus 59%) when the same question was posed in terms of “aid to the poor.” The average relative distance for these three question is 54%, which means that Obama-Trump voters’ attitudes were about midway between those of other Trump and non-Trump voters.
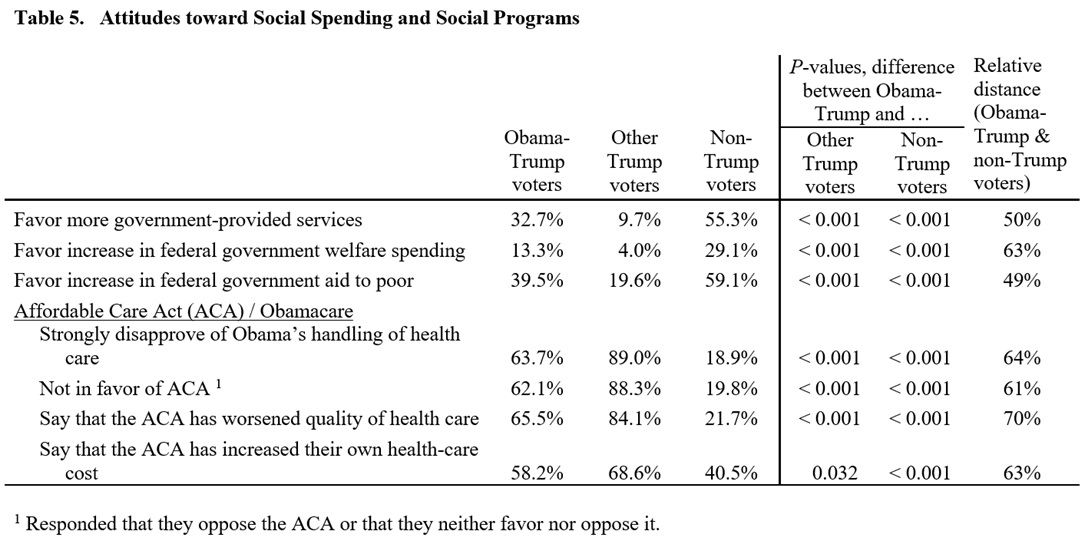
A substantial majority of Obama-Trump voters did not like the major new social program––the Affordable Care Act (ACA), popularly known as Obamacare. Sixty-four percent strongly disapproved of Obama’s handling of the health-care issue. And 62% did not favor the ACA itself; 66% said that it had worsened the quality of healthcare; and 58% claimed that it had increased the cost of their own health care.[16] On average, the relative distance for the ACA questions is 64%, which means that Obama-Trump voters’ attitudes were almost twice as far away from those of non-Trump voters as they were from those of other Trump voters.
The results presented in Tables 4 and 5 differ from the tables on other attitudes, which will be presented below, in one key respect: the differences between the attitudes of Obama-Trump voters and other Trump voters are very statistically significant. (The differences between the attitudes of Obama-Trump voters and non-Trump voters are also very statistically significant, but that is true regarding almost all of the attitudinal variables presented here.) This suggests that Obama-Trump voters are clearly distinct from both other Trump and non-Trump voters with respect to Obama, the Democratic Party, and social welfare programs (but not nearly as clearly distinct from other Trump voters in other respects).
I do not know why that is the case. There are several possible reasons, including Obama-Trump voters’ relative lack of interest in and knowledge of politics, which would lead to a lot of random responses which, when aggregated, make Obama-Trump voters seem to be a “middle-of-the-road” bloc. There is evidence for this in the ANES data, particularly the fact most Obama-Trump voters made up their minds about whom they would vote for a good deal later than other voters did. Another possible reason is that there may be a distinct minority of Obama-Trump voters that is more liberal and/or identified with the Democrats than other Obama-Trump voters are. Evidence for this includes the fact that 29% of Obama-Trump voters approved of Obama and the fact that 31% of them said that they were Democrats or closer to the Democrats than to the Republicans.
Attitudes toward Immigrants and Immigration
Obama-Trump voters were far to the right of non-Trump voters, and much closer to other Trump voters, insofar as immigrants and immigration are concerned. The average relative distance for the variables on this issue presented in Table 6 is 87%; and, for 10 of the 13 questions, the differences between the responses of Obama-Trump and other Trump voters are not SSCS (i.e., P > 0.05).
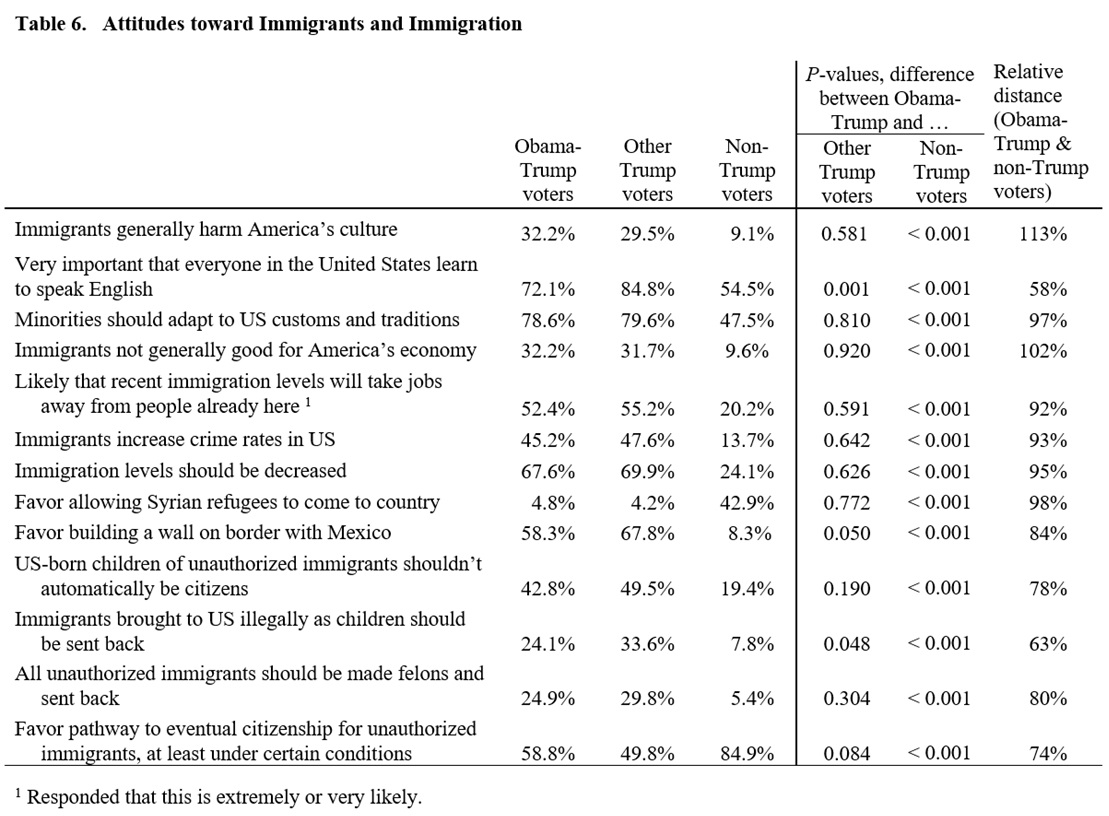
Obama-Trump voters’ responses to a question on whether immigrants are good for America’s culture were a bit more extreme than those of other Trump voters. So were their responses to a question on whether immigrants are good for America’s economy.
Their responses to another 7 questions were at least 4 times as far away from those of non-Trump voters as they were from those of other Trump voters––questions on letting Syrian refugees into the US; on adaptation of minorities to US customs and traditions; on reduction of immigration levels; on criminal behavior among immigrants; on whether immigrants “take jobs away” from others; on Trump’s wall on the Mexican border; and on declaring unauthorized immigrants to be felons and deporting them.
The remaining 4 cases pertain to questions on eliminating the Constitution’s granting of citizenship to everyone born in the US, including children of unauthorized immigrants; on a pathway to citizenship for unauthorized immigrants, either with or without conditions; on deportation of people illegally brought into the US as children; and on the importance of everyone in the US learning English. In all of these cases, too, Obama-Trump voters’ attitudes were closer to those of other Trump voters than to those of non-Trump voters.
The percent-point difference between the responses of Obama-Trump and non-Trump voters was greater than 30 points with respect to 6 questions––Trump’s border wall (58% vs. 8%); reduction in immigration levels (68% vs. 24%); admission of Syrian refugees (5% vs. 43%); immigrants “taking away jobs” (52% vs. 20%); immigrants’ criminal behavior (45% vs. 14%); and adaptation of minorities to American customs and traditions (79% vs. 47%).
Authoritarianism
Obama-Trump voters’ responses indicate that they are, on the whole, much more authoritarian than non-Trump voters. In 4 of the 9 cases presented in Table 7, their responses are also more authoritarian than those of other Trump voters. In the remaining 5 cases, their responses were at least 4 times as far away from those of non-Trump voters as they were from those of other Trump voters.
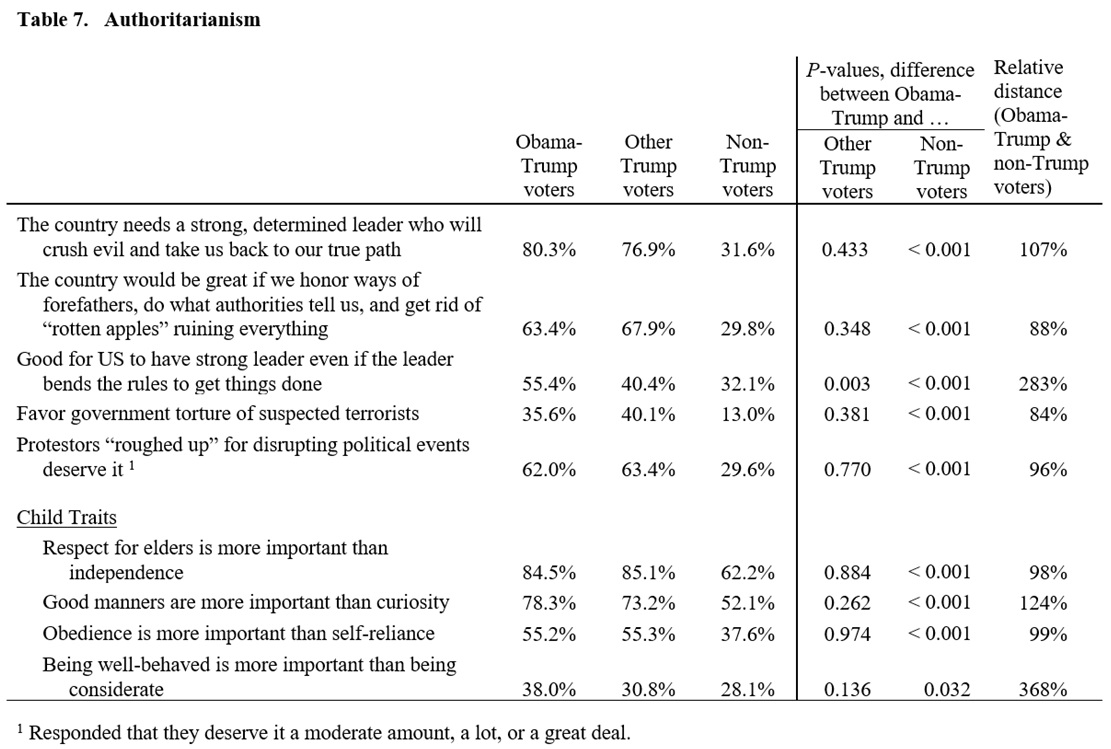
The average relative distance for the 9 questions is 150%, though it drops to 99% after two outliers are removed (the questions on the desirability of a strong leader who “bends the rules” and on the relative importance of children being well-behaved versus considerate). Because the differences between the Obama-Trump and other Trump voters’ responses are SSCS in only one case (the “bends the rules” question, to which Obama-Trump voters’ responses were far more authoritarian), we lack sufficient evidence to conclude that one group is more authoritarian than the other. The safest conclusion to draw from the results is thus that Obama-Trump voters are, at minimum, as authoritarian as other Trump voters.
The first two questions presented in Table 7 together comprise what Smith and Hanley call the “Domineering Leader” scale, which tries to capture the desire for strong, aggressive leaders who will punish outsiders (“crush evil” and “get rid of ‘rotten apples’”). Taken together, they yield the conclusion that Obama-Trump and other Trump voters desire a domineering leader to roughly the same extent.
Three other questions presented in the table address different aspects of the desire for authoritarian leadership. The “bends the rules” question goes to the issue of strong leadership; Obama-Trump voters’ responses to it were more much more authoritarian than even the responses of other Trump voters. The questions on torture of suspected terrorists and “roughing up protestors” go to the issue of punishing outsiders. Obama-Trump voters’ responses to these questions were slightly less authoritarian than the responses of other Trump voters, but far more authoritarian than the responses of non-Trump voters.
The four “Child Trait” questions try to capture the submissiveness of those who desire authoritarian leadership. These questions purposely have no obvious connection to politics; they are intended to decouple submissiveness to authority from right-wing political attitudes. Obama-Trump and other Trump voters’ responses to two of these questions––on the relative importance of respect for elders versus independence, and of obedience versus self-reliance––were almost identical. With respect to the other two questions––on the relative importance of good manners versus curiosity, and being well-behaved versus considerate––Obama-Trump voters’ responses were more authoritarian than those of other Trump voters, though, again, the differences are not SSCS.
Attitudes toward Blacks
The data presented in Table 8 make clear that Obama-Trump voters’ attitudes toward blacks are, on the whole, very different from those of non-Trump voters, and similar to those of other Trump voters. The average relative distance for the 11 questions in the table is 93%, which means that Obama-Trump voters’ responses were, on average, about 12 or 13 times as far away from those of non-Trump voters as they were from those of other Trump voters.
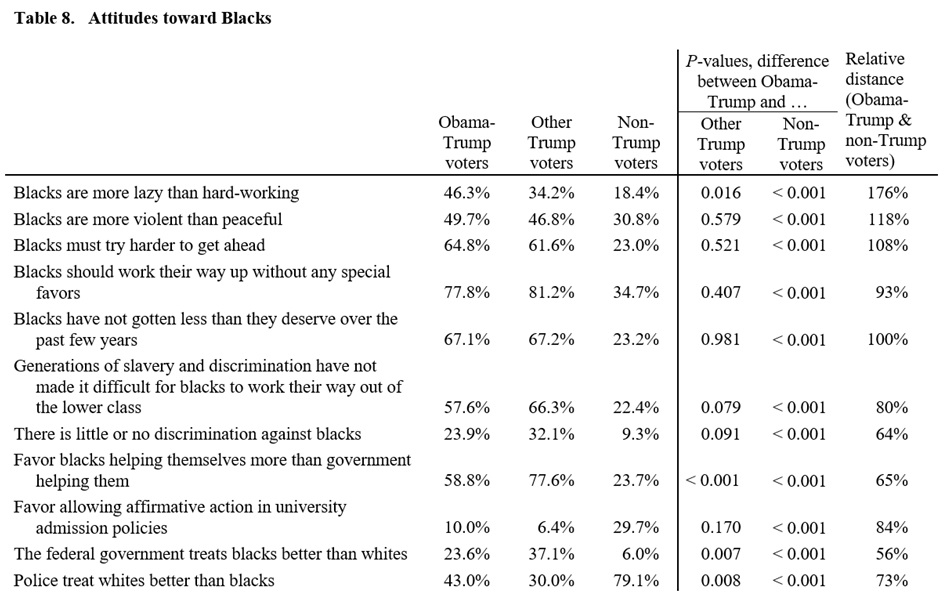
Obama-Trump voters’ responses to the first three questions––on the alleged laziness of blacks, on their alleged violence, and on whether they need to try harder to get ahead––were even more negative toward blacks than the responses of other Trump voters were.
Obama-Trump voters’ responses to another four questions were at least 4 times as far away from those of non-Trump voters as they were from those of other Trump voters––the questions on whether blacks should “work their way up without special favors”; on whether slavery and past discrimination have made that difficult; on whether they “have gotten less than they deserve over the past few years”; and on allowing affirmative-action admissions policies in universities. The remaining four questions pertain to the continued existence of discrimination against blacks; to whether blacks should help themselves more than the government helps them; to federal government treatment of blacks compared to whites; and to how police treat the two groups. In all of these cases, too, the responses given by Obama-Trump voters were closer to those of other Trump voters than to those of non-Trump voters.
The percent-point difference between the responses of Obama-Trump and non-Trump voters was greater than 30 points with respect to 6 of the 11 questions––whether blacks have recently gotten less than they deserve (67% vs. 23%); whether they should “work their way up without special favors” (78% vs. 35%); whether they must try harder (65% vs. 23%); police treatment (43% vs. 79%); difficulties due to slavery and past discrimination (58% vs. 22%); and self-help versus government assistance (59% vs. 24%).
The middle seven questions in the table all address, in different ways, the issue of self-help versus anti-discrimination efforts. Yet the relative distance between Obama-Trump and non-Trump voters’ responses to these questions varies greatly, from a high of 108% to a low of 64%. I have not been able to formulate a hypothesis that might explain this variation.
Attitudes toward Women
The most striking feature of Table 9 is the tremendous gap between Trump voters’ and non-Trump voters’ stated views on whether Trump treats women poorly. While 86% of non-Trump voters said that he does, only 23% of Obama-Trump voters and only 12% of other Trump voters said the same thing. (It is unclear how many Trump voters believed what they said and how many were instead engaged in a performative act of “post-truth” politics.) The percentage-point gaps between Obama-Trump and non-Trump voters’ responses to the other questions presented in the table are much smaller.
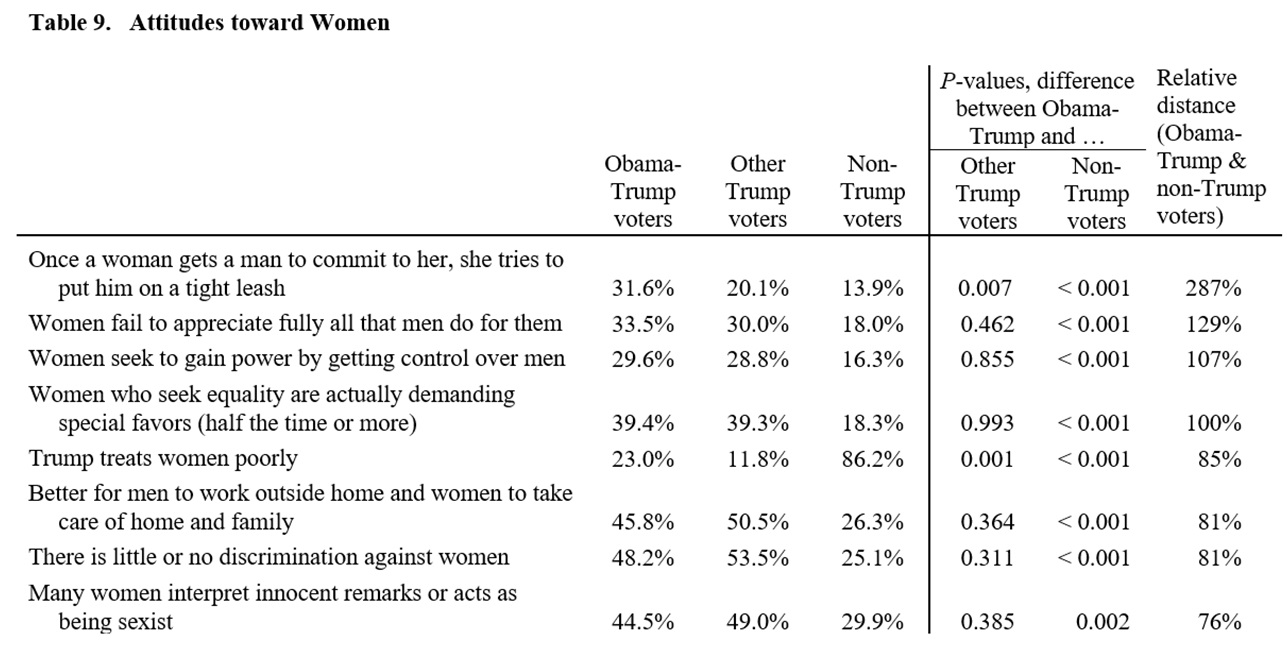
On the whole, Obama-Trump voters’ attitudes toward women are very different from those of non-Trump voters and very similar to those of other Trump voters. Except for the question about Trump’s treatment of women, none of the differences between the responses of Obama-Trump and other Trump voters is SSCS.
The average relative distance for the 8 questions in the table is 118% (falling to 94% if the question about women putting men on a “tight leash” is removed). Obama-Trump voters’ responses to half of the questions were even more unlike the responses of non-Trump voters than other Trump voters’ responses were. These questions pertained to women putting men on a tight leash, failing to appreciate what men do for them, seeking to control men, and demanding special favors in the name of equality.
The remaining questions were about Trump’s treatment of women, traditional gender roles in the family, the continuing existence of discrimination against women, and “many women’s” interpretation of “innocent remarks or acts.” Obama-Trump voters’ responses to each of these questions were at least 3 times as far away from those of non-Trump voters as they were from those of other Trump voters.
Attitudes toward Hispanics, Muslims
The first three questions about Hispanics presented in Table 10––about whether they are lazy, whether they are violent, and whether their political influence is too great––engendered a more anti-Hispanic response from Obama-Trump voters than from other Trump voters (non-Trump voters’ responses were the least anti-Hispanic). Yet too much should not be made of this result, since the percentages of people who gave anti-Hispanic responses were relatively small, and the differences between the responses of Obama-Trump and other Trump voters are not SSCS.
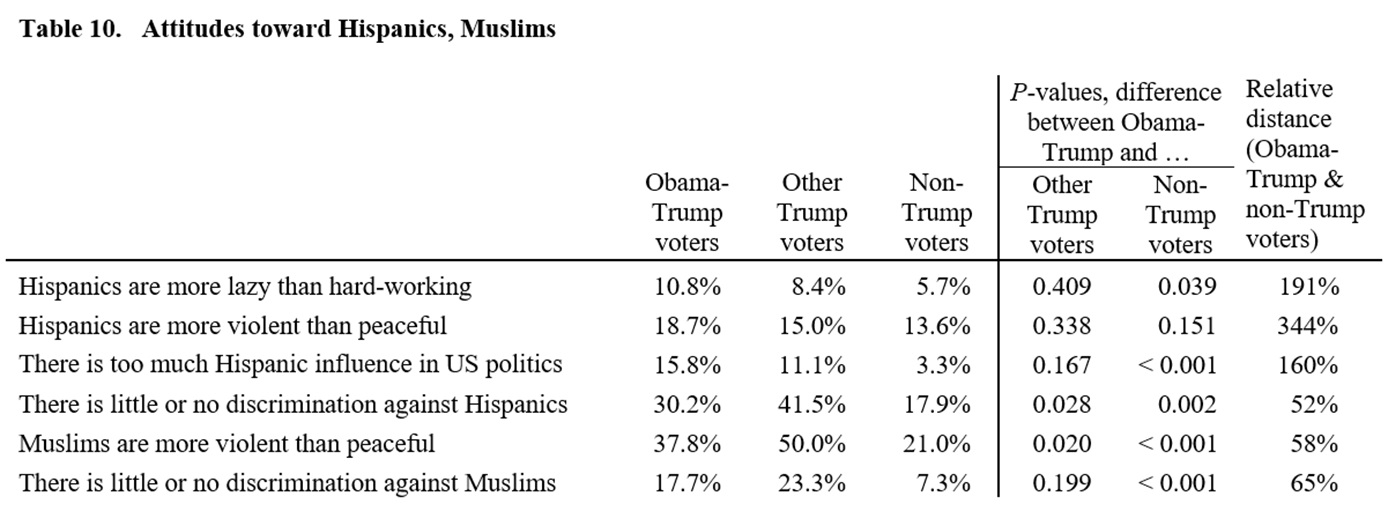
The remaining question in the list that pertains to Hispanics is about whether they are discriminated against. The share of Obama-Trump voters who said that such discrimination is minimal or nonexistent is midway between the shares of other Trump and non-Trump voters who gave that response, and differences between the voter groups are SSCS.
The final two questions in the table pertain to attitudes toward Muslims. Obama-Trump voters were almost twice as likely as non-Trump voters to say that Muslims are more violent than peaceful, and more than twice as likely to claim that discrimination against them is minimal or nonexistent. Other Trump voters were even more likely to respond in these ways. Obama-Trump voters’ responses to these questions were somewhat closer to those of other Trump voters than to the responses of non-Trump voters, and the differences between Obama-Trump and other Trump voters’ responses to the discrimination question are not SSCS.
Views on International Affairs
The first question in Table 11 measures the degree of isolationist sentiment. Obama-Trump voters were the most likely to give isolationist responses (40%); non-Trump voters were the least likely (27%). The difference between Obama-Trump and non-Trump voters’ responses is SSCS, and the difference between Obama-Trump and other Trump voters’ responses is almost SSCS.
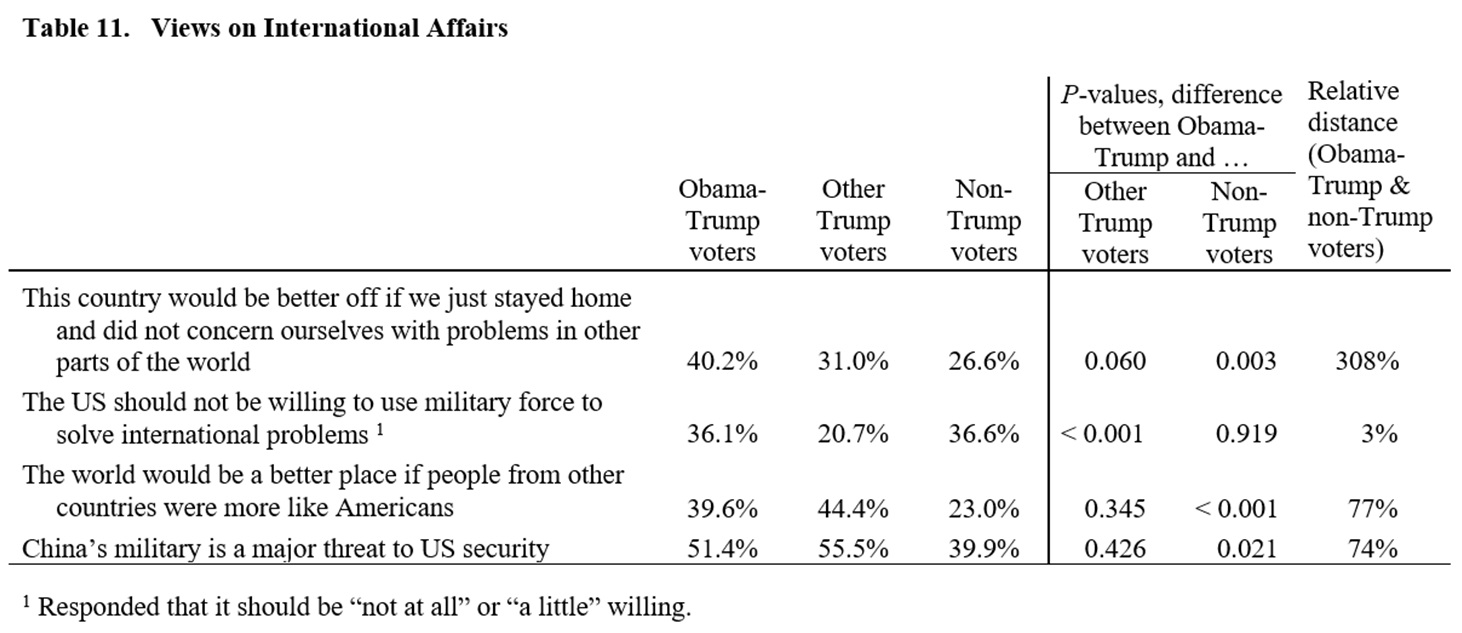
The second question is about whether the US should be willing to use military force abroad. This is one of the very rare cases in which the responses of Obama-Trump and non-Trump voters were very similar; 36% of Obama-Trump voters and 37% of non-Trump voters said that the US should be unwilling or only a little willing to use force abroad. (In contrast, only 21% of other Trump voters responded in the same way; the difference between the responses of Obama-Trump and other Trump voters is very SSCS.) However, given the difference between Obama-Trump and non-Trump voters with respect to isolationism, it seems likely that their similar responses to the military-force question stem from somewhat different motivations. The Obama-Trump voters’ responses were probably more often a reflection of isolationist sentiment, while the non-Trump voters’ responses were probably more often a reflection of antiwar or pacifist views.
The third question is about whether the world would be better if people from other countries were more like Americans. The fourth question is about whether China’s military is a major threat. In both cases, other Trump voters were the most likely to say yes; non-Trump voters were the least likely. Obama-Trump voters were in the middle, but their responses in both cases were about 3 times as far away from those of non-Trump voters as they were from those of other Trump voters, and the differences between the responses of Obama-Trump and other Trump voters are not SSCS.
7. Summary and Conclusions
The findings presented in this article make clear that the voters who flipped from Obama to Trump were not engaged in a working-class rebellion against a rapacious neoliberalism that inflicted economic hardship on them. Several possible measures of economic hardship (low median income, a high share of low-income people, a high unemployment rate, and job loss among family members and close friends) all indicate that Obama-Trump voters were not more likely to be personally experiencing economic hardship than non-Trump voters.
Moreover, the reasons that Obama-Trump voters volunteered, prior to the election, about what might make them vote for Trump, bear little resemblance to the anti-neoliberal “left” narrative. Only 4% of their responses mentioned jobs, and none mentioned any anti-neoliberal “left” talking point or policy item on the social-democratic wish list. And responses to several multiple-choice questions about social spending and social programs likewise indicate that Obama-Trump voters were less favorably inclined toward welfare-state measures than non-Trump voters were.
So, what were the actual attitudes and concerns of Obama-Trump voters? This article has shown that
- their views on Obamacare and other social-spending issues were much to the right of non-Trump voters’ views
- about four-fifths of the answers that Obama-Trump voters’ volunteered, in response to a question about why they might vote for Trump, focused on Trump’s personality or background, immigration policy, the voter’s desire for change, or “culture-war” issues of the American right
- there were indications of authoritarian attitudes in many of the volunteered responses, and responses to 9 multiple-choice questions indicate that the attitudes of Obama-Trump voters were much more authoritarian than those of non-Trump voters
- responses to 13 multiple-choice questions indicate that Obama-Trump voters were much more hostile than non-Trump voters to immigrants and immigration
- responses to about two dozen multiple-choice questions indicate that Obama-Trump voters’ attitudes toward blacks, women, Hispanics, and Muslims were more negative than those of non-Trump voters
- Obama-Trump voters’ responses to the questions on immigration, authoritarianism, and attitudes toward blacks, women, and Hispanics were far closer to those of other Trump voters than to those of non-Trump voters; and their responses were often to the right of other Trump voters
Owing to the descriptive approach that this article has taken, these findings do not show what caused Obama voters to flip to Trump. (In order to properly draw causal inferences, one needs to control for other influences, which a descriptive account does not do.) But they are quite suggestive. The findings establish that, with respect to several major issues and themes of the 2016 election, there was a significant degree of affinity between Obama-Trump voters’ attitudes and Trump’s pronouncements and behavior. They therefore make a prima facie case for the hypothesis that these voters’ flip to Trump was driven by that affinity.
Whither the Anti-Neoliberal “Left”: A Word to the Wise
In its effort to explain Obama-Trump voters’ flip to Trump, the anti-neoliberal “left” has been barking up the wrong tree. Few if any of these voters want to take their country back to the pre-neoliberal era. Instead, the evidence suggests that what many or most of them want is to take their country back.
The anti-neoliberal “left” would do well to take heed of these findings, in order to appreciate the breadth of Trumpist sentiment in the US and thereby be better equipped to engage in a serious fight against Trumpist reaction. This is not the time to indulge in self-serving, wishful thinking that racist, misogynistic, nativist, and authoritarian voters are a ready-made “constituency” for one’s version of “left” politics and one’s “leadership.” There is a real danger that the opposite will happen––that is, that the anti-neoliberal “left” will be led further and further toward the camp of reaction as it seeks to accommodate the Trumpite base in order to win it over.
Abbreviation
SSCS = statistically significant by conventional standards
Notes
[1] By anti-neoliberal “left,” I do not mean those opposed to neoliberalism––which no one on the left supports––but tendencies that oppose neoliberalism while shirking from opposition to capitalism in all of its forms, especially tendencies that seek to make common cause with the far right, celebrate the rising popularity of reactionary alternatives to neoliberalism as a progressive blow struck by the working class, and/or regard neoliberalism as the main enemy.
[2] The 9.2 million estimate is based on a poll conducted by the University of Virginia Center for Politics. Data in the 2016 American National Election Study (ANES) suggest that there were 8.4 million Obama-Trump voters; and Cooperative Congressional Election Study (CCES) data suggest that there were 6.7 million. A subsequent analysis of the CCES data, by McElwee, et al., based on “validated voter turnout” in 2016 rather than survey respondents’ affirmations that they voted, puts the number at 6.0 million. (However, my efforts to replicate their results have not succeeded. I have written to them about this and am awaiting their reply.)
In contrast, ANES data indicate that only 2.5 million voters “flipped” from Mitt Romney (the 2012 Republican candidate) to Clinton (the 2016 Democratic candidate). The CCES data lead to an estimate of 2.7 million.
Any estimate of the total size of the Obama-Trump vote should be treated cautiously. Surveys overestimate the votes received by winning candidates, like Obama and Trump; their vote shares in surveys are greater than their vote shares in the actual election results. It seems that some voters lie about their vote, in order to identify themselves with the winner. Others presumably cannot accurately recall whom they voted for. And some respondents may misreport their past votes in order to make their past choices seem to conform to their current views. (The CCES has less bias stemming from the last two of these problems, since its 2012 numbers are based on respondents’ reported votes at that time, not 2016 reports of how they voted in 2012. But it, too, is subject to identification-with-the-winner misreporting.)
[3] “Socialist Alternative used what we call ‘the transitional method’: We connect with the consciousness of everyday people, meet them where they are at….” Ramy Khalil, “How a Socialist Won––Lessons from Kshama Sawant’s Historic Victory,” Socialist Alternative, Jan. 31, 2014, https://bit.ly/2GrEAJp . [This footnote is part of the 2018 Perspectives.]
[4] Marxist-Humanist Initiative’s 2018 Perspectives lay out a radically different politics and radically different approach to “white working-class” Trump voters. In contrast to Left-Firstism, this document stands on the ground of working people’s self-development and self-emancipation. And drawing on Karl Marx’s writings and activity (during the US Civil War and the struggle to free Ireland from English rule) to combat what is now known as white nationalism, the document calls for “solidarizing with the ‘white working class’ by decisively defeating Trumpism, white supremacism, etc. Their defeat will help liberate the ‘white working class’ from the grip of reaction and spur its independent emancipatory self-development.” (The quoted material appears on p. 45 of the online version of the Perspectives and p. 61 of pamphlet version.)
[5] See Appendix 2, Table C3b, of Thomas Piketty, Emmanuel Saez, and Gabriel Zucman, “Distributional National Accounts: Methods and Estimates for the United States.” National Bureau of Economic Research Working Paper 22945, Dec. 2016; available here.
[6] After the Perspectives were published, a couple of additional studies that control for the influence of other variables have come out. They, too, disconfirm the economic distress hypothesis. Instead, David Norman Smith and Eric Hanley find that racial and other prejudice, and desire for an authoritarian leader, are largely what “predicts” support for Trump. Diana Mutz provides evidence that less-educated voters’ strong support for Trump is due to “status anxiety” among members of dominant groups (the feeling of being threatened by the “browning” of American society and the possible end of US global dominance).
[7] There is one exception. When I discuss responses to the open-ended question, the numbers and percentages refer to the unweighted number of answers.
[8] The standard errors used in the significance tests are the “raw” standard errors multiplied by the “design effect” (DEFT), i.e., the square root of the sum of the squared weights divided by the square root of the sum of the weights. The DEFT in this case is approximately 1.21, so the reported P-values are about 17% (= (1 – [1/1.21]) × 100%) larger than they would have been if the ANES data had been drawn from a simple random sample.
[9] In a couple of cases, indicated in the tables using the symbol “N/A” (not applicable), Obama-Trump voters and other Trump voters are on opposite ends of the spectrum. In these cases, relative distance is not a meaningful measure.
[10] My mean-age estimates use the reported age (in years) of people between 22 and 89 years old, and the estimated harmonic mean age of people 90 years old and older (the top age cell of the ANES dataset). The latter is different for each voter group. My estimates of the harmonic means assume that top-cell ages are Pareto-distributed, and I used maximum likelihood estimation to obtain the distribution’s shape parameter.
[11] The total-sample means are $68,000; $88,000; and $86,000, for Obama-Trump, other Trump, and non-Trump voters, respectively. The total-sample medians are $49,000; $69,000; and $61,000. Mean-income estimates use the midpoints of the first 27 income cells. For the top (28th) cell––income of $250,000 or greater––I estimated the cell’s harmonic mean (which differs across the three voter groups). My estimates of the harmonic mean assume that top-cell incomes are Pareto-distributed, and I used maximum likelihood estimation to obtain the distribution’s shape parameter. Hypothesis tests on median income assume that the incomes of each group are distributed log-normally.
[12] The Census Bureau’s “money income” construct is very restrictive and misleading. It excludes noncash income––such as Medicare, Medicaid, and other health-insurance benefits, as well as food stamps and housing subsidies––which is a disproportionately large share of seniors’ income. When noncash income is counted, the gap between seniors’ incomes and others’ incomes narrows considerably. However, it is appropriate to refer to money income in the present context, because “income” in the ANES dataset refers to income as reported by the respondent, and it is doubtful that many respondents regarded noncash income as part of their “income.”
[13] The US government’s official unemployment rate during the period in which ANES asked about employment status (September–November, 2016) was 5.0% or less––much lower than Table 2’s figures for Obama-Trump and non-Trump voters, and a bit lower than its figure for other Trump voters. I believe that the most likely explanation of the discrepancy is not misrepresentation by respondents, but differences in how “unemployed” is defined. The government employs a quite restrictive definition of “unemployed,” while ANES basically allows respondents to apply whatever definition they want. The absence of restrictions boosts the percentage of people who are “unemployed.”
[14] Ackerman seems to object to, and conflate, two entirely distinct things. One is inferring motivations from attitudes and evidence of attitudes. But what is the objection? For example, X declares that he hates Y; then he murders Y. What, exactly, is wrong with inferring that he hated Y and murdered him out of hatred? Ackerman also seems to object to inferring individuals’ attributes from group attributes. But doing so is objectionable only if it is done improperly. Stereotyping––attributing a characteristic of a group to some particular member of that group, or to all of its members––is not a sound procedure, but the objects of Ackerman’s criticism have not engaged in stereotyping. He picks at a statement––in a journalist’s semi-popular discussion of scholarly research!––that characterized Trump’s base as “people … motivated by racial resentment.” This statement is an unexceptionable generalization, not a stereotype. Ackerman seems not to understand the difference.
[15] The multiple-factor responses that mentioned jobs were “immigration policies/create jobs,” “patriotism, safety, security and improve the jobs for locals,” “addressing corruption, security and jobs, “ and “Like alot of thinks he wants to do, bring jobs back to American, increase inport taxes, defend against ISIS, just dont like Hillary Clinton.”
[16] I say “claimed” because, while voters may well know whether their health-care costs have increased, few have the information or ability to determine whether the ACA was the cause of that increase.
Editors’ note: Minor typos in this article were corrected on August 11, 2018.

Be the first to comment