
by Andrew Kliman
A lot of attention has been paid to “Obama-Trump” voters––people who voted for the Democrat (Barack Obama) in the 2012 presidential election but “flipped” to the Republican (Donald Trump) in 2016––mostly because Trump’s Electoral College victory is largely attributable to their “defection” from the Democrats. In addition, the anti-neoliberal “left” has consistently pointed to Obama-Trump voters in an effort to support its allegation that Trump’s victory was due to a rebellion, by a significant segment of working-class voters, against the “economic distress” or “economic hardship” that neoliberalism inflicted on them.
Last August, I published a detailed profile of Obama-Trump voters’ demographic characteristics, their attitudes and political positions, and their expressed reasons for voting for Trump. The article made clear that the anti-neoliberal “left” narrative about the 2016 election is fatally flawed. It identified two main reasons why the “flip” to Trump cannot properly be characterized as a working-class rebellion against economic hardship imposed by neoliberalism.
First, various measures of economic hardship all indicate that Obama-Trump voters were not more likely to be personally experiencing economic hardship than non-Trump voters. Once one controls for differences in the shares of people in the two groups who were 65 and older, their median incomes were almost identical and Obama-Trump voters were not more likely than non-Trump voters to have low incomes. Nor were they more likely to be unemployed or to have had a relative or close friend recently lose a job.
Second, Obama-Trump voters’ reasons for voting for Trump bear little resemblance to the anti-neoliberal “left” narrative. Asked before the election about why they might vote for Trump, their volunteered responses contain very little evidence of opposition to neoliberal economics or a preference for social-democratic programs. Their views regarding the Affordable Care Act (ACA; i.e., Obamacare) and other social-spending issues were much to the right of non-Trump voters’ views. And their responses to dozens of survey questions about attitudes to immigration, authoritarianism, blacks, women, and Hispanics were far closer to the responses of other Trump voters than to the responses of non-Trump voters, and sometimes even more extreme.
By revealing a significant degree of affinity between Obama-Trump voters’ attitudes and Trump’s pronouncements and behavior, my study made a prima facie case for the hypothesis that these voters’ flip to Trump was driven by their Trumpian attitudes. However, owing to its descriptive approach, the study did not, strictly speaking, demonstrate that this hypothesis is correct. In order to properly draw causal inferences, one needs to control for other influences, which a descriptive account does not do.
The present article follows up on that study. It controls for other influences––holds other factors constant––by means of regression analysis, and it focuses exclusively on people who reported that they voted for Obama in 2012 and that, in the 2016 presidential election, they either voted once again for the Democratic candidate (Clinton) or flipped to Trump. The question it seeks to answer is: What factors determined whether such voters stuck with the Democrats or flipped to Trump, and how important were each of these factors?
The results of the analysis indicate that the hypothesis is indeed correct. Among this group of Obama voters, support for Trump relative to Clinton was driven by negative attitudes to immigrants and immigration; to blacks; to the ACA; and to women; and by a preference for authoritarian leadership. In addition, support for Trump was somewhat stronger among men and (non-Hispanic) whites than among women and people of color, even after controlling for other factors. Isolationist sentiment was also a small, but statistically significant, determinant of support for Trump.
In contrast, none of the regression model’s measures of personally-experienced economic hardship––low income, unemployment, and recent job loss of a relative or close friend––proved to be a determinant of Obama voters’ support for Trump relative to Clinton. And even though the raw data suggests that support for Trump was disproportionately strong among voters without four-year college degrees (who are frequently but misleadingly dubbed “working class”), the regression results indicate that, once other factors are controlled for, such people were slightly less likely than the college-educated to favor Trump.[1] In other words, support for Trump among “non-college” voters has nothing to do with their “class” or their relative lack of formal education. It stems from differences in attitudes (to blacks, immigrants, women, authoritarian leadership, etc.); among people whose attitudes were similar, those with college degrees were a bit more likely to flip to Trump than those without such degrees.
Given the large amount of attention that has been paid to Obama-Trump voters, in scholarly works as well as in popular media, it is somewhat surprising that very few statistical studies have sought to explain directly, as the present article does, why Obama voters did or did not flip to Trump. I know of only one other statistical study that has tried to do so, Ferguson et al. (2018), a rather problematic analysis that tries to rescue part of the anti-neoliberal “left” narrative from the many empirical studies that disconfirm it. In addition, I know of one study that takes a similar but slightly different approach, Reny et al. (2018). It studied the factors that determined whether a voter flipped to Trump in 2016 after having voted for Obama or for a third-party candidate in 2012, and its analysis is restricted to white voters. After presenting my own regression results, I will compare them to the results of both of these studies.
The Data
My sample of Obama voters comes from the 2016 American National Election Study (ANES), just as the data in my previous article did. It consists of 1155 respondents, seven-eighths (1011) of whom voted for Clinton and one-eighth (144) of whom voted for Trump.
While my previous article reported on voters’ weighted responses to survey questions—based on the ANES post-election survey weights––my regression analysis employs the unweighted data, in order to improve the estimates. I found that my dependent variable, a Trump vs. Clinton “feeling thermometer,” which measures the difference between the voter’s ratings of the two candidates, is uncorrelated with the ANES survey weights (r = –0.004). Owing to the absence of correlation, unweighted regression estimates are more “efficient”—they have smaller standard errors—than weighted regression estimates (see Winship and Radbill 1994).
Further information on my regression variables and handling of the data is contained in the Appendix to this article. In addition, my previous article contains discussion of features and limitations of the ANES study that is not repeated here, so the present article should be read in conjunction with it.
Descriptive Statistics
Starting with the dependent variable––Trump vs. Clinton feeling––Table 1 reports on the mean values and standard deviations of each of the regression variables, for the whole set of voters in the sample and also for the two subsets, Obama-Clinton voters and Obama-Trump voters. In all cases, the minimum value of the variable is 0 and the maximum value is 1.
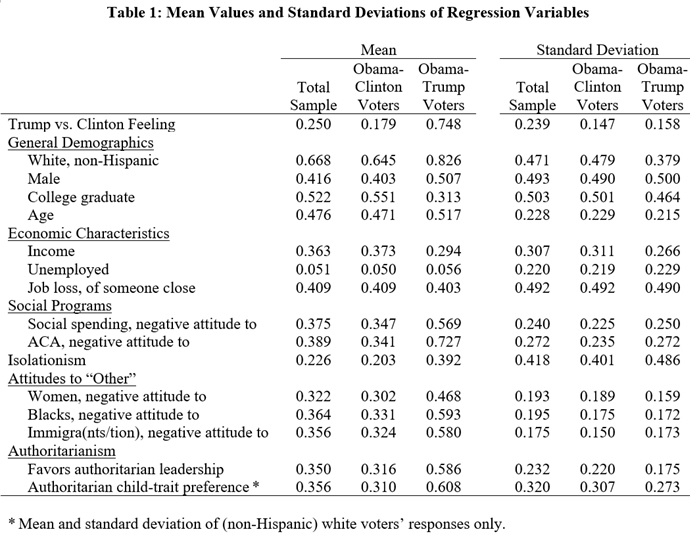
The differences between the subsets of voters are quite similar to those discussed in my previous article, which is not surprising, since the regression model’s independent variables were constructed from responses to many of the same questions and the sample of voters is largely the same.[2]
Obama-Trump voters’ attitudes to women, blacks and immigrants and immigration were a good deal more negative than the attitudes of Obama-Clinton voters; and they were a good deal more authoritarian; more hostile to social spending in general and especially to the ACA; and substantially more likely to be isolationist. They were also disproportionately white, male, and older, and a good deal less likely to be college graduates. In contrast, there was little difference between the two groups’ economic characteristics, on average. The one seeming exception is the lower mean income of Obama-Trump voters, but this is basically an artifact stemming from the fact they were much more likely to be seniors (people 65 years old and older), as I discussed in my previous article.
The top row of Table 2 reports the pairwise (uncontrolled) correlation coefficients between the dependent variable and each of the independent variables. The remaining rows report the pairwise correlation coefficients of the independent variables with one another. In general, the dependent variable is rather more strongly correlated with the variables pertaining to attitudes and policy views than it is with voters’ general demographic and economic characteristics. This suggests that we should expect, a priori, that attitudes and policy views will have a bigger role than will demographic and economic characteristics in explaining voters’ relative ratings of Trump and Clinton.
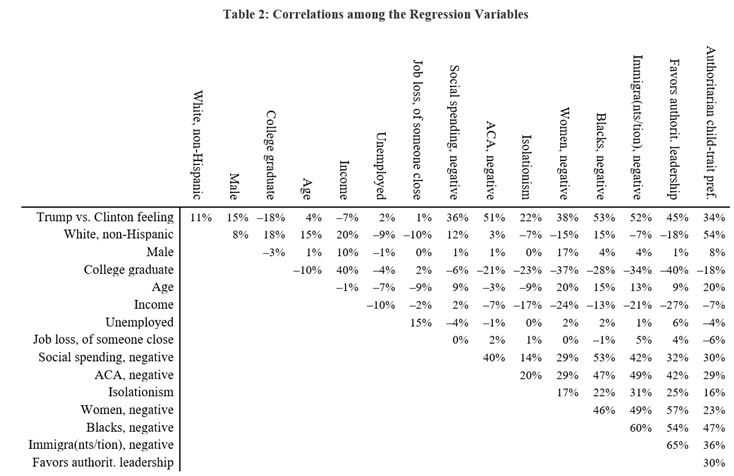
Note also the fairly substantial negative correlations between the “college graduate” variable and most of the attitudinal variables. The negative correlations suggest that the disproportionate support that Trump received from voters without four-year college education may be more reflective of their attitudes to “out-groups” and of a preference for authoritarian leadership than reflective of “working-class” status or lack of formal education.
Finally, note that most of the attitudinal variables and the variables pertaining to views of social programs are fairly strongly correlated with one another. This multicollinearity does not unduly compromise the regression model’s ability to estimate the contributions of the different independent variables to an explanation of Trump vs. Clinton feeling, since the variance inflation factors (VIFs) are all 2.3 or smaller.[3] It does suggest, however, that the attitudinal and policy-related determinants of support for Trump are a complex of interrelated attitudes and views, not a series of discrete and neatly separable variables.
In particular, it is noteworthy that there are fairly strong correlations between negative attitudes to the ACA, on the one hand, and negative attitudes to blacks and immigra(nts/tion) as well as a preference for authoritarian leadership, on the other hand. As Tesler (2012) documented several years ago, opinions about health-care issues have been “racialized”––polarized on the basis of survey respondents’ race and their racial attitudes––for some time, and they became substantially more racialized after Obama became president and the “face of Obamacare.” The pairwise correlations presented in Table 2 suggest that, at least among people who voted for Obama in 2012, the polarization is not associated with race and racial attitudes alone. The correlations between views of the ACA and the immigra(nts/tion) and authoritarian-leadership variables are roughly equal in size to the correlation between views of the ACA and attitudes to blacks.
Since attitudes to immigrants and immigration are closely bound up with attitudes to race, it is not surprising that people who had negative views of the ACA were more likely to have negative attitudes, not only to blacks, but to immigrants and immigration as well. It may be more surprising, however, that negative views of the ACA were also bound up with a desire for authoritarian leadership.
Regression Results
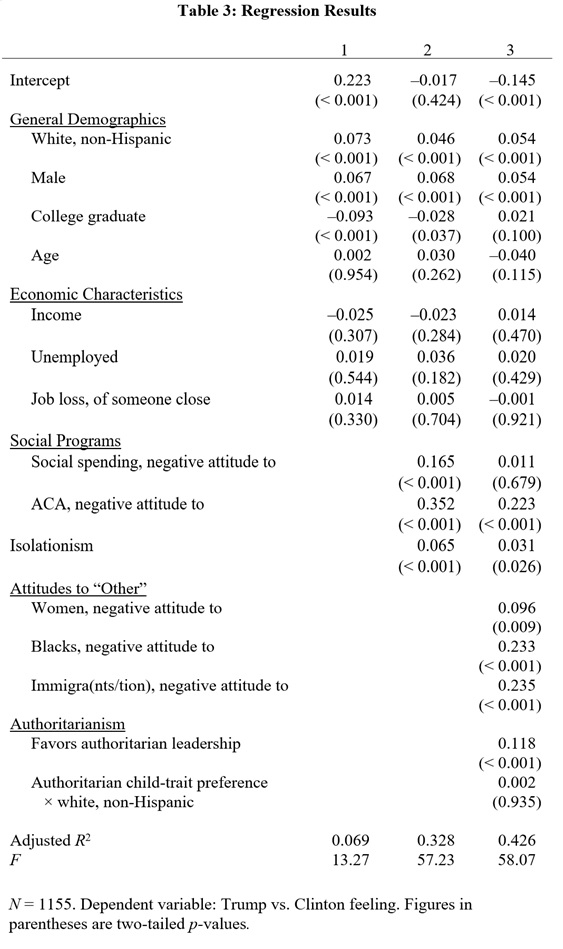
I recoded all variables, and the components of all scales, so that they range from 0 to 1.[4] The recoding yields regression coefficients that are readily understood: The size of the coefficient on each independent variable is the estimated amount by which the dependent variable, Trump vs. Clinton feeling, changes as we move from the lowest to the highest value of the independent variable, i.e., from 0 to 1.
Consider, for example, two otherwise-identical voters, one with a least-negative attitude to blacks (0) and one with a most-negative attitude (1). If the former’s Trump vs. Clinton feeling score is 0.200, the latter’s is estimated to equal 0.200 + 0.233 = 0.433, since the estimated regression coefficient for “negative attitude to blacks” is 0.233 (see Column 3 of Table 3). If, however, the two voters differ in an additional respect as well––the first voter has a least-negative attitude to immigrants and immigration (0) while the second has a most-negative attitude (1)––then their estimated Trump vs. Clinton feeling scores are 0.200 and 0.200 + 0.233 + 0.235 = 0.668, since the estimated regression coefficient for “negative attitude to immigra(nts/tion)” is 0.235.
General Demographic and Economic Characteristics
Column 1 of Table 3 shows that we cannot account for the flip from Obama to Trump purely in terms of voters’ demographic and economic characteristics. When these are the only independent variables considered, the model accounts for a mere 7% of the variance in Trump vs. Clinton feeling, even though the statistical significance of the race, gender, and educational-attainment variables is extremely high and these variables all appear to influence the value of the dependent variable to a moderate extent. It is also noteworthy that even in this very stripped-down model, in which the economic-characteristic variables are not “competing for influence” with attitudinal variables and policy views, they fail as predictors of Trump support. The coefficients on these variables are extremely small and none of them are close to being statistically significant by conventional standards.
Adding in Policy Views
Column 2 shows that when policy views––the two social-program variables and the isolationism variable––are added in, the model accounts for about one-third of the variance in Trump vs. Clinton feeling. The statistical significance of all of the newly added variables is extremely high, and both social-program variables seem to be quantitatively important predictors of support for Trump. In contrast, the apparent contributions of race and, especially, educational attainment to an explanation of support for Trump are reduced. The coefficients on the economic-characteristic variables continue to be very small and far from being statistically significant by conventional standards.
Adding in Attitudinal Variables (the Full Model)
Once attitudinal variables––the “attitudes to ‘other’” and authoritarianism variables––are also added in, the regression model explains somewhat less than half of the variance in the dependent variable, as the adjusted R2 figure at the bottom of Column 3 indicates.
The contributions of race and gender to an explanation of support for Trump are roughly the same as before, and the statistical significance of these variables continues to be extremely high. This may indicate that Trump garnered disproportionate support from voters with strong white and male identities, or it may indicate that the race and gender variables are acting as proxies for other, unidentified factors that are the actual contributors to support for Trump. The educational-attainment variable now has the “wrong” sign––once other factors have been held constant, voters without college degrees are seen to be a bit less supportive of Trump than those who hold such degrees, contrary to what we are led to expect from the narrative about Trump’s election being a “working-class” revolt. The statistical significance of the educational-attainment variable is marginal, however.
The coefficients on the economic-characteristic variables continue to be extremely small and far from being statistically significant by conventional standards. Moreover, the income and “job loss, of someone close” variables now have the “wrong” signs. (Higher-income voters appear to be more supportive of Trump than lower-income ones, and having a close relative or friend who recently lost their job seems to reduce voters’ support for Trump.) However, given the small size and statistical insignificance of the coefficients, too much should not be made of the anomalous signs. The soundest interpretation is that there is no evidence that personally-experienced economic hardship had any influence at all on Obama voters’ decisions about whether to flip to Trump.
Once attitudinal variables are added in, the contributions of all three social-policy variables to an explanation of support for Trump are smaller than they appeared to be before. The coefficient on the social-spending variable is now extremely small and far from being statistically significant by conventional standards. The coefficient on the isolationism variable falls by about one-half, and its statistical significance is somewhat attenuated. In contrast, despite its fairly strong correlations with several of the attitudinal variables, the “negative attitude to the ACA” variable remains an important predictor of support for Trump. The size of the coefficient on this variable is reduced by a little more than one-third, but it remains large––about the same size as the coefficients on the “negative attitude to blacks” and “negative attitude to immigra(nts/tion)” variables––and its statistical significance is extremely high.
All of the attitudinal variables except “authoritarian child-trait preference” perform well or extremely well as predictors of support for Trump. The “negative attitude to blacks” and “negative attitude to immigra(nts/tion)” variables are both estimated to increase Trump vs. Clinton feeling by 0.23 points (on a 0- to 1-point scale) as one moves from a voter with the least-negative attitude to a voter with the most-negative attitude. These are the largest coefficients in the regression model. The “favors authoritarian leadership” variable is estimated to increase Trump vs. Clinton feeling by 0.12 points as one moves from the least- to the most-authoritarian voter.[5] And the “negative attitude to women” variable is estimated to increase Trump vs. Clinton feeling by 0.10 points as one moves from the least- to the most-negative voter. The statistical significance of the coefficients on all four variables is extremely high.
The evidence thus indicates that these four variables, plus the “negative attitude to the ACA” variable, are the main predictors of the flip from Obama to Trump. If we compare a hypothetical voter whose score is 1 in all 5 dimensions (most opposed to the ACA, most anti-woman, most anti-black, most anti-immigra(nt/tion), and most authoritarian) with another hypothetical voter whose score is 0 in all five dimensions, the Trump vs. Clinton feeling score of the former is estimated to be 0.223 + 0.096 + 0.233 + 0.235 + 0.118 = 0.904 points greater than the Trump vs. Clinton feeling score of the latter. This is quite close to 1, the maximum possible difference.[6]
The other variables that retained a statistically significant effect (by conventional standards) in the full regression model are race, gender, educational attainment, and isolationism. The estimated influence of the first two on support for Trump is moderate; the estimated influence of the latter two is small. As noted above, the results pertaining to race and gender may indicate either that voters who embrace white and male identity were especially supportive of Trump, or that these variables are standing in for determinants of support for Trump that were absent from the model.
The Five Main Predictors as a Complex of Interrelated Attitudes and Views
Earlier in this article, I noted that the fairly strong correlations among some of the attitudinal and policy-related determinants of support for Trump suggest that these are not neatly separable variables, but a complex of interrelated attitudes and views. To investigate this matter further, I ran a regression on the standardized variables and used the results, along with partial correlation coefficients among the standardized variables, to compute both the direct effect of each independent variable on Trump vs. Clinton feeling (the dependent variable), and its indirect effects––how the variable affects the dependent variable through its effects on the model’s other independent variables.
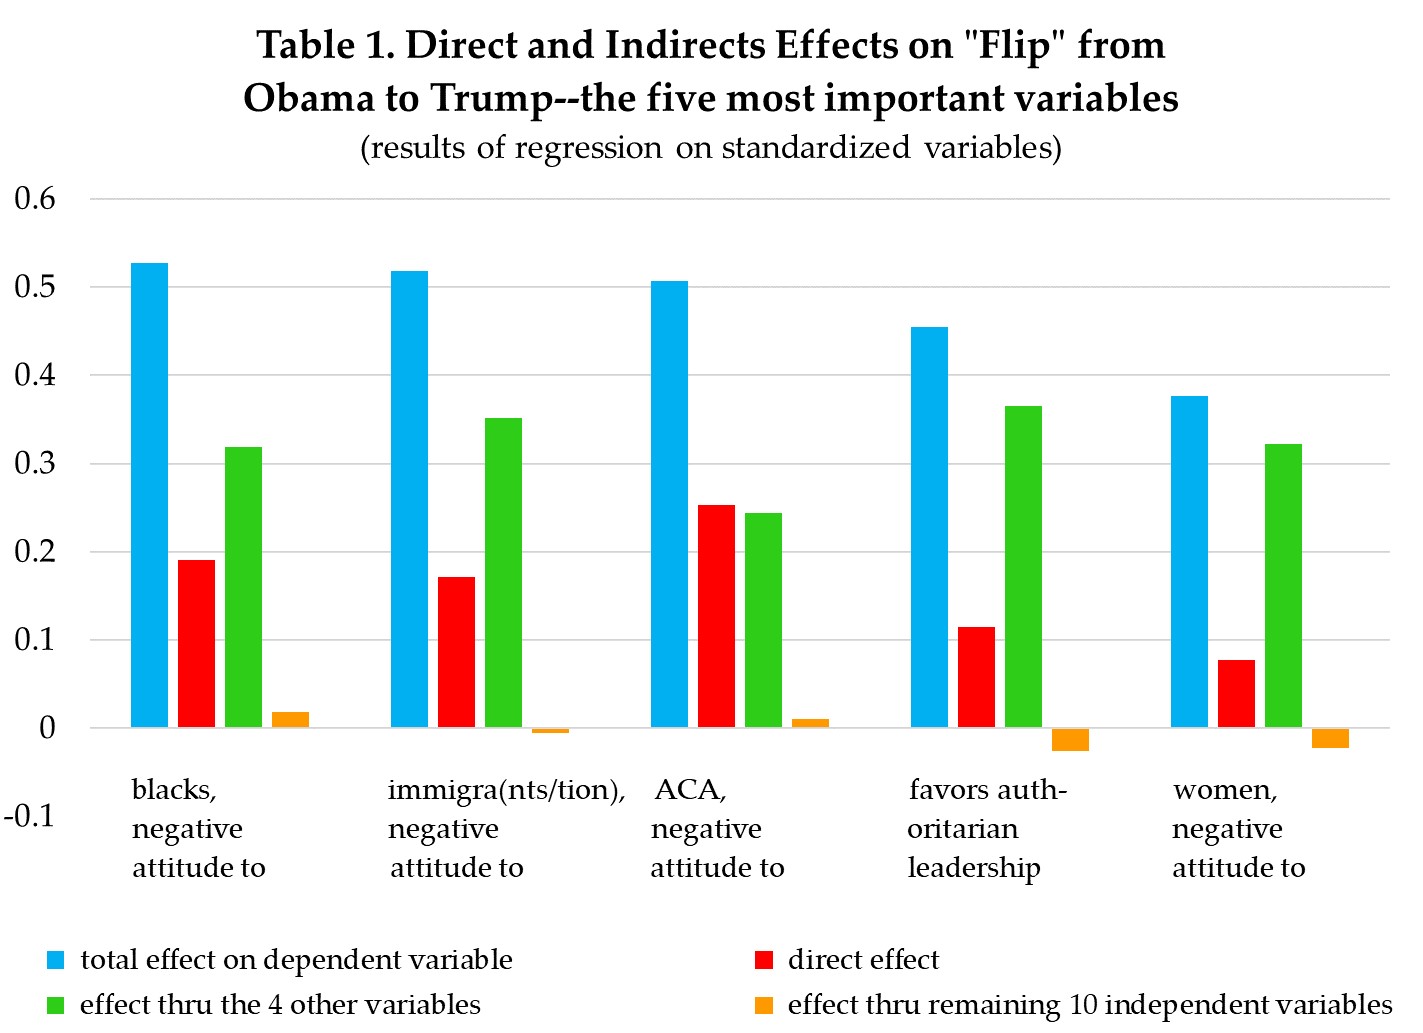
As Figure 1 shows, I found that the five main predictors of support for Trump relative to Clinton all had sizable indirect as well as direct effects. Indeed, in four of the five cases, the indirect effect outweighed the direct effect. And in every case, almost all of the variable’s indirect influence is due to its influence on the other four main predictors rather than to its influence on the model’s ten other independent variables. This is further (and better) evidence that the five main predictors of support for Trump among Obama voters are a complex of closely interrelated attitudes and views. (It is better evidence because, in contrast to the correlation coefficients reported in Table 2, other factors have been held constant here when measuring each variable’s direct and indirect effects).
Although the regression model was able to estimate how much each independent variable contributed to an explanation of Trump vs. Clinton feeling, since the sizes of the VIFs indicated that multicollinearity among the variables was not a serious problem in this case, the estimated sizes of the individual variables’ coefficients and p-values will be affected by any degree of multicollinearity. I therefore performed an experiment, the results of which should allay concerns stemming from the multicollinearity issue, about the ability of the model to predict support for Trump relative to Clinton. I combined the five main predictors of support for Trump into a single superscale and then re-ran the model. I obtained almost identical results.
Specifically, the adjusted R2 was almost the same as before––0.420 instead of 0.426––and the coefficient on the superscale was almost the same as the sum of the coefficients on its components that I reported above––0.905 instead of 0.904. (The changes in the other 11 coefficients, including the intercept, were also very small. The changes in their absolute values ranged from 0.0004 to 0.0160, with a mean of 0.0063.) Thus, even though the multicollinearity among the independent variables does affect, to some degree, the estimated impact of the individual variables, the experiment confirms what I reported earlier about the combined impact of the five main predictors of support for Trump.
Comparison to Other Studies
My regression results are broadly consistent with those of almost all empirical studies of voting behavior in the 2016 presidential election. Employing a variety of statistical models, studying various subgroups of the voting populations, and utilizing several different datasets, empirical studies have consistently found that support for Trump was not associated with voters’ personally experienced economic distress. In contrast, racism and anti-immigra(nt/tion) sentiment have consistently been found to have been main drivers of support for Trump, and some studies have also found that sexism, authoritarianism, and discontent with cultural change were important factors as well, though there is not a consensus regarding their influence.
But what about Reny et al. (2018) and Ferguson et al. (2018), the two studies, other than the present one, that have sought to explain directly why Obama voters did or did not flip to Trump? How do my results compare to theirs?
Reny et al.
Reny et al. (2018) utilized a different dataset, restricted their focus to white voters, and sought to identify the factors that led voters to flip to Trump after having voted for either Obama or a third-party candidate in 2012. Their sets of control variables and explanatory variables were also different from mine in many respects. For example, they included variables pertaining to voters’ ideology, political-party identification, and subjective assessments of change in their economic situation, but excluded variables pertaining to authoritarianism and attitudes to women.
In light of these many differences, it is tricky to compare the results of the two studies. Nonetheless, several important similarities stand out clearly. Reny et al. found, as I did, that both racial attitudes and attitudes to immigration were substantial and statistically significant determinants of whether a voter did or did not flip to Trump. They also found, as I did, that none of the several variables in their model pertaining to voters’ objective economic characteristics––income, employment status, income below the median in the voter’s county of residence, and changes since 2000 in their county’s unemployment rate and number of manufacturing jobs––were determinants of vote-switching.
The one economic indicator in their model that did play a role, albeit a “marginally small” one (Reny et al. 2018: 28), was voters’ subjective characterization of the extent to which their household income had changed during the previous four years. Given that the variables pertaining to objective economic factors, two of which likewise involve changes in economic conditions, had no effect on whether a voter did or did not flip to Trump, it seems very likely that this is a case of reverse causation. Instead of declining income being the cause and support for Trump being the effect, support for Trump (and the actual determinants of that support) made some voters more likely to report that their income had fallen and/or to characterize the fall as substantial.
Ferguson et al.
Before turning to the empirical results contained in Ferguson et al. (2018), a comment on what they are arguing against is in order. In the headline of an article summarizing their findings, the authors declare that “Economic Distress Did Drive Trump’s Win.” The study itself contends that “[s]ome leading analysts have concluded that … Trump was elected by ‘deplorables,’ fueled by racial resentment, sexism, and fear or dislike of immigrants from abroad. Economics, they say, made little or no difference.” Yet in fact “economic factors also played a big part. Possibly even a bigger part” (Ferguson et al. 2018: 3, 46; emphasis omitted).
Similar characterizations of what leading analysts have supposedly concluded are contained in favorable publicity about the article, featured prominently on the website of the research institute that sponsored it. For example, an Intercept article claims that it “challenges the popular conventional wisdom embraced by many pundits that the 62.9 million Americans who cast a vote for Trump were simply one-dimensional ‘deplorables’—troglodytes motivated narrowly by racist, sexist, and xenophobic rhetoric and little else.” And in a Jacobin interview, the study’s lead author mocks “the Clinton campaign’s notion that [Trump’s election] was all due to the ‘deplorables’,” and he claims that this notion has “crystallized into ‘common sense’ in so many quarters.”
However, the five authors of this 71-page study have engaged in a massive research effort to refute a strawman. The leading analysts they cite who supposedly concluded that “[e]conomics … made little or no difference” to the outcome of the 2016 election have said no such thing.[7]
Insofar as the “flip” from Obama to Trump is concerned, the authors’ economic-distress argument promises a good deal more than it delivers empirically. Their study of this issue is similar to mine in several respects––both employ ANES data, examine whether Obama voters of 2012 flipped to Trump in 2016, and include voters of all races. More to the point, several of their findings are very similar with mine, and none can be plausibly construed as inconsistent.
They present two slightly different models meant to account for the flip from Obama to Trump. The results of both models indicate, as my results do, that racism and sexism were strong and statistically significant predictors of support for Trump. Both of their models also include what they call a “need strong leader” variable, which likewise proves to be a strong and statistically significant predictor of Trump support. This, too, is in keeping with my own results, inasmuch as the “need strong leader” variable is a component of my “favors authoritarian leadership” scale.[8]
In both of their models, there are five additional independent variables (one also contains an interaction term). Only one of these variables, race, appears in my regression model as well. Ferguson et al. find, as I did, that it was a statistically significant predictor of Trump support (although, in one model, only the interaction between race and another independent variable of theirs, views on import restriction, is statistically significant).
Notably absent from both of their models are any variables pertaining to voters’ personal economic situation––income, employment status, etc. (as well as any demographic control variables other than race). Obviously, then, their results do nothing to substantiate the notion that economic distress personally experienced by voters drove Trump’s win. However, having found that Obama voters who believed that the country was on the wrong track were more likely to flip to Trump, Ferguson et al. (2018: 26–7, 42) opine that “‘wrong track’ assessments were probably driven in good part by economic anxieties,” “fueled by a combination of social and economic discontent.” Perhaps, but this is speculation, not evidence.
More importantly, the authors fail to investigate the causes of economic discontent, blithely attributing them to neoliberalism. They do not consider the possibility that economic discontent among Obama-Trump voters was a spillover effect, a consequence of the noneconomic factors that caused them to be dissatisfied with Obama’s presidency and the country’s direction, though a good deal of evidence suggests that this was indeed the case.[9]
One of their two models does include an objective economic variable, median earnings in the voters’ congressional districts. Ferguson et al. find that low median earnings were associated with greater Trump support, but this result is suspect for a number of reasons. One is that a variable considered in the other model (views on whether imports should be restricted) is omitted from this one, for some unexplained reason. They seem to be tinkering with their regression model, a procedure that can easily turn small and statistically insignificant coefficients into apparently larger and significant ones. Second, the almost-complete absence of demographic-control variables from the model, and the fact that it includes only seven other independent variables, contribute to the same problem; as a rule, when genuinely explanatory variables are omitted, the apparent impact of the variables that are included increases, whether they are genuinely explanatory or not.
Third, the authors admit to having done a good deal of “exploratory” work before selecting which variables to include and which models to publish (Ferguson et al. 2018: 25–6)––that is, to having done a lot of “data fishing” in an effort to find “predictive” models and “statistically significant” variables. This is not objectionable, by itself, but their frequent claims to be reporting empirical results is incorrect. What they report are hypotheses. They have not used the data to test already-existing hypotheses. They have used it to construct their models––in other words, to arrive at as-yet-untested hypotheses.
Fourth, the “result” is suspect on theoretical grounds. If low median earnings in the voter’s congressional district were a genuine predictor of support for Trump, then why have so many studies found that similar economic variables––the voters’ own incomes, their employment status, etc.––were not? And why are such variables omitted from their own model? (The answer is clearly not that they overlooked the potential explanatory power of income. Some other models in the Ferguson et al. study do contain income variables.)
I suspect that the apparent influence of low median earnings is either a mere statistical artifact, or that this variable is acting as a proxy for certain cultural and social attitudes found disproportionately in some locales (e.g., rural congressional districts). The latter possibility is similar to what has been found out about Trump’s strong support among people without college degrees: the college-education variable acts as a proxy for racial hostility, anti-immigrant sentiment, and other attitudes that appear disproportionately among “non-college” voters, and much or all of its apparent influence on support for Trump thus disappears when the effects of these attitudes are properly controlled for.
In sum, Ferguson et al. fail to provide any credible evidence that economic distress personally experienced by Obama-Trump voters is what motivated their flip to Trump. They thus support their claim that “Economic Distress Did Drive Trump’s Win” by employing the Humpty Dumpty strategy: “When I use a word, it means just what I choose it to mean—neither more nor less.”
Other researchers use the terms “economic distress” and “economic hardship” to refer to voters’ own, objective, economic circumstances. The now-standard finding that economic distress did not “drive Trump’s win” means that, once one controls for other determinants of vote choice, people who have personally experienced difficult economic circumstances (low income, unemployment, etc.) were not more likely than other voters to support Trump.
In the hands of Ferguson et al., however, “economic distress” is turned into a catch-all term that includes “concerns about imports and job losses, wealth inequality, social welfare programs, and starved infrastructure.” This serves to protect the economic-distress claim from being refuted by the substantial and growing body of evidence that personally experienced economic hardship did not “drive Trump’s win.” The existence of discontent about any economic matter now counts as evidence of “economic distress,” and hard evidence that neoliberalism (rather than racism, xenophobia, etc.) is the source of that discontent is unnecessary. Speculation is good enough.
By showing that “economics” (in some sense) affected the election outcome and speculating that voters’ economic concerns reflect dissatisfaction with neoliberalism, the authors seem able to rescue a portion of the anti-neoliberal “left” narrative––but at the cost of changing that narrative. Instead of Trump’s election being ascribed to working-class voters’ rebellion against objective, personally experienced economic hardships that neoliberalism inflicted on them, it is portrayed as a (right-wing) populist rebellion, the class basis of which is left unspecified, against economic policies and outcomes that the authors––and, they contend, these populist voters––disapprove of.
Whatever. From the “Left First” perspective, the important thing is the bottom line, which remains the same: the Democrats should “try to win back white working class voters through left-oriented economic policies on jobs, wages, health care and the like … combined with cautious treatment of immigration and international trade” (Ferguson et al. 2018: 50; emphasis added).
Those who want to find out why our references to the anti-neoliberal “left” enclose the term “left” in scare quotes need look no further. But readers who wish to better understand the roots of its ideology, politics, and symbiotic relationship with Trumpism––particularly in order to help transform the left into a force that once again stands for freedom and the rights of all human beings––should consult Marxist-Humanist Initiative’s 2018 Perspectives thesis, Resisting Trumpist Reaction (and Left Accommodation).
References
Abramowitz, Alan, and Jennifer McCoy (2018). “United States: Racial Resentment, Negative Partisanship and Polarization in Trump’s America.” Subsequently published in Annals of the American Academy of Political and Social Sciences, Jan. 2019.
Ferguson, Thomas, Benjamin Page, Jacob Rothschild, Arturo Chang, and Jie Chen (2018). “The Economic and Social Roots of Populist Rebellion: Support for Donald Trump in 2016.” Institute for New Economic Thinking, Working Paper No. 83, October.
MacWilliams, Matthew C. (2016). American Authoritarianism in Black and White. Ph.D. dissertation, Univ. of Massachusetts.
Mutz, Diana C. (2018). “Status Threat, not Economic Hardship, Explains the 2016 Presidential Vote,” Proceedings of the National Academy of Sciences 115(19), E4330-E4339, May 8.
Pérez, Efrén O., and Marc J. Hetherington (2014). “Authoritarianism in Black and White: Testing the Cross-Racial Validity of the Child Rearing Scale,” Political Analysis 22, pp. 398–412.
Reny, Tyler T., Loren Collingwood, and Ali Valenzuela (2018). “Vote Switching in the 2016 Election: How Racial and Immigration Attitudes, Not Economics, Explain Shifts in White Voting.” (Forthcoming at Public Opinion Quarterly.)
Sides, John, Michael Tesler, and Lynn Vavreck (2018). Identity Crisis: The 2016 Presidential Campaign and the Battle for the Meaning of America. Princeton: Princeton University Press.
Smith, David Norman, and Eric Hanley (2018). “The Anger Games: Who Voted for Donald Trump in the 2016 Election, and Why?,” Critical Sociology 44(2), pp. 195–212.
Tesler, Michael (2012). “The Spillover of Racialization into Health Care: How President Obama Polarized Public Opinion by Racial Attitudes and Race,” American Journal of Political Science 56(3), pp. 690–704.
Winship, Christopher, and Larry Radbill (1994). “Sampling Weights and Regression Analysis,” Sociological Methods & Research 23(2), pp. 230–57.
APPENDIX
This appendix provides further information on the data, my handling of it, and individual regression variables.
The ANES Sample
There were 1219 people in the ANES database who voted for Obama in 2012 and voted for either Clinton or Trump in 2016. Sixty-four of them had to be removed from the sample because their responses to some questions were missing or invalid. Almost all voters who were removed refused to supply some demographic information, especially income, age, and/or gender.
Regression Variables
Some independent variables in my regression equation consist of responses to a single ANES question. All of the general-demographic and economic-characteristics variables are of this type; so is the isolationism variable. In these cases, when one or more responses were missing or invalid, the observation had to be removed from the sample. The remaining independent variables are scales that average together responses to three or more related questions.[10] In these cases, observations with invalid or missing information were retained in the sample (unless a voter’s responses to every component of a scale was missing). The voter’s average score for the scale was computed from the components of the scale for which s/he provided valid responses.
In a further effort to retain respondents in the sample, “don’t know,” “haven’t thought much,” and similar responses were reassigned middle values (i.e., a value of 0.5, since all of my regression variables range from 0 to 1). I employed the same procedure for “neither agree nor disagree,” “both,” and “neither” responses to binary options.
My previous article on Obama-Trump voters summarized voters’ attitudes in terms of binary options. In contrast, my regression variables generally preserve the full range of responses contained in the ANES dataset. For example, responses to questions that asked voters whether they “strongly disagree,” “disagree somewhat,” “neither agree nor disagree,” “agree somewhat,” or “strongly agree” with a statement, and coded by ANES on a five-point scale, are recoded here as 0, 0.25, 0.5, 0.75, and 1.
There are a couple of exceptions, however. One is the education variable, which is intended to capture the distinction between voters with, and voters without, four-year college degrees. Thus, the value of this variable is 1 if the respondent had at least a four-year college degree and 0 if s/he did not.[11] The other is the income variable. The income intervals in the ANES dataset are very unequal, ranging from $2500 (e.g., $20,000 to $22,499) to $75,000 ($175,000 to $249,999). I recoded the income data in terms of seven intervals of $25,000 each, from $0–$24,999 to $150,000–$174,999, plus a final income class for incomes of $175,000 and above.[12]
Dependent Variable: Relative Trump vs. Clinton Feeling Thermometer
Almost all regression analyses of voters’ choices in the 2016 election have sought to directly explain respondents’ votes. That is, they have used the candidate for whom the respondent voted as the dependent variable. I have instead adopted the approach taken by Abramowitz and McCoy (2018: 10), whose dependent variable is the voter’s “relative feeling thermometer ratings of Trump and Clinton.” They argue, correctly in my view, that the relative feeling thermometer “provide[s] a more nuanced measure than the dichotomous [Trump, Clinton] vote choice question,” while nonetheless “strongly predict[ing] vote choice.” In addition, by employing this (almost) continuous dependent variable instead of the usual dichotomous one, I was able to run a linear rather than a logistic regression. This is an important advantage, since the regression results are much more easily interpreted.
My “relative feeling thermometer” variable measures the difference between the voter’s feelings toward Trump and Clinton, as reported after the election.[13] It is equal to
(100 + [Trump feeling score – Clinton feeling score])/200
where the Trump and Clinton feeling scores range from 0 (most negative toward the candidate) to 100 (most positive toward the candidate). The relative feeling thermometer variable thus ranges from 0 to 1; a value of 0 indicates that the voter gave Trump the lowest possible score and Clinton the highest possible score, while a value of 1 indicates the opposite. A value of 0.5 indicates that the voter gave the two candidates equal ratings.
Abramowitz and McCoy (2018: 10) supported their claim that a relative feeling thermometer variable “strongly predict[s] vote choice” by noting that, in their sample of white voters, “only three percent … rated Trump and Clinton equally … and 97 percent of those rating one candidate higher on the scale reported voting for that candidate.” In my sample (which is based on the same survey but which includes voters of all races), only 2.4% of voters rated the two candidates equally, and 97.7% of those rating one candidate higher than the other reported voting for that candidate.
Independent Variables
- The “general demographics” regression variables, pertaining to race, gender, educational attainment, and age, are four of the seven demographic variables included in Table 1 of my previous article.
- The “economic characteristics” regression variables, pertaining to income, employment status, and job loss of someone close, are three of the four variables included in Table 2 of that article. The remaining economic variable in Table 2, which pertained to the voters’ concern about their family’s financial situation, is not included in the regressions because, as I discussed in the article and in my review of Identity Crisis, it seems not to be a genuinely independent variable. There is strong evidence that financial worries and other expressions of “economic anxiety” were largely effects, rather than causes, of voters’ feelings about Trump and Clinton.
- The “social spending” regression variable is a scale made up of the first three questions included in Table 5 of my previous article.
- The ACA (Affordable Care Act) variable is a scale made up of the final three of the four ACA questions included in the same table. The remaining ACA question in that table, pertaining to Obama’s handling of health care, was omitted from the regressions due to a concern that, because it refers to Obama, it is likely not to be a genuinely independent variable that predicts Trump vs. Clinton feeling. It may, instead, be an effect of attitudes to Trump and Clinton. For example, pro-Trump voters may have decided to support him for other reasons but, having done so, then took on board his opposition to Obama’s health-care policies. Another (not mutually exclusive) possibility is that responses to the Obama question and Trump vs. Clinton feeling vary together because both are effects of racial attitudes and/or other variables.
- The “isolationism” regression variable is the first of the four questions, pertaining to views on international affairs, included in Table 11 of my previous article.
- The “attitudes to women” variable is a scale made up of seven of the eight questions included in Table 9 of my previous article.[14] The omitted question asked whether Trump treats women poorly. I left it out of the scale due to a concern that responses to it were likely to be, in part, effects rather than causes of attitudes to Trump. Given the great disparity between the percentages of non-Trump and Obama-Trump voters who said that Trump treats women poorly (86% vs. 23%), it is quite possible that many of the Obama-Trump voters were not providing a heartfelt evaluation of his treatment of women, but were instead “engaged in a performative act of ‘post-truth’ politics”––that is, using the question as a way to declare their support for Trump.
- The “attitudes to blacks” variable is a scale made up of all 11 questions included in Table 8 of my previous article.
- The “attitudes to immigra(nts/tion)” variable is a scale made up of all 13 questions included in Table 6 of my previous article.
- The “favors authoritarian leadership” variable is a scale made up of the first five questions included in Table 7 of my previous article.
- The “authoritarian child-trait preference” variable is a scale made up of the remaining four questions included in the same table. Because this scale, intended to capture authoritarian submissiveness, is regarded by some analysts as an invalid measure when applied to blacks,[15] my regression analysis employs it in conjunction with a “white, non-Hispanic” interaction term. In effect, then, the regression equation estimates the degree to which authoritarian submissiveness among non-Hispanic whites accounts for variation in Trump vs. Clinton feelings of 2012 Obama voters.
Many of the six dozen variables discussed in my previous article do not appear in the regression equations. This is partly because the article and the regression analysis have different aims. The article sought to describe Obama-Trump and other voters’ attitudes and demographic traits, while the regression analysis seeks to explain their vote choices.
Thus, the regression analysis omits a fair number of variables which have descriptive value but which seemed unlikely, a priori, to be “predictors” of Trump vs. Clinton feeling. Such variables include: the marital status, gun-ownership, and home-ownership questions reported in Table 1 of the previous article; most of the questions about voters’ views on international affairs included in Table 11; and the questions on attitudes to Hispanics and Muslims, reported in Table 10.
I conjectured that the questions on attitudes to Hispanics and Muslims would have little predictive value for two reasons. First, differences between Obama-Trump and non-Trump voters’ responses to these questions were generally rather small. Second, the regression model’s “attitudes to immigra(nts/tion)” variable is likely to capture much of whatever predictive value the questions might otherwise carry.
In other cases, variables were omitted from the regression equations due to concern that they are either effects, not causes, of attitudes to Trump and Clinton, or that they and attitudes to the candidates co-vary because they are both determined in part by the same “third variables.” Some of these cases were discussed above. In addition, all of the questions included in Table 4 of the previous article, pertaining to attitudes toward Obama and the Democratic Party, were omitted from the regression equation because of the possibility that they are effects of, or jointly determined with, the dependent variable.
Endnotes
[1] This result should be treated somewhat cautiously, however, since the statistical significance of the variable is marginal. The two-tailed p-value is 0.100, so one could plausibly maintain, instead, that educational attainment was not found to have influenced the flip from Obama to Trump one way or the other.
[2] However, my previous article did not report on the characteristics and attitudes of Obama-Clinton voters specifically. It reported on the characteristics and attitudes of all non-Trump voters, a group that also includes everyone who voted for a third-party candidate in 2016 as well as everyone who voted for Clinton but not for Obama.
[3] The VIF measures the extent to which the variance in an independent variable is accounted for by the totality of the model’s other independent variables. Most researchers regard a VIF of 10 or greater as evidence of a serious multicollinearity problem; some regard VIFs in excess of 2.5 as potentially problematic.
[4] The values of the “white, non-Hispanic,” “male,” “college graduate,” “unemployed,” “job loss, of someone close,” and “isolationism” variables are either 0 or 1 (or, in rare cases, 0.5). The other regression variables take on multiple values between 0 and 1.
[5] This variable is a scale made up of five questions. Two of the five are what Smith and Hanley (2018) call the “Domineering Leader” scale. I ran a regression in which that scale replaced the five-question “favors authoritarian leadership” scale. The coefficient on “Domineering Leader” was 0.086 rather than 0.118. On the other hand, the p-value on the coefficient declined slightly, while the adjusted R2 and F-values increased slightly. Coefficients on the other independent variables in the model did not change substantially,
[6] An infinite number of ratings of Trump and Clinton could result in a difference of 0.904. One is that the first voter gave Trump a rating of 95.2 and Clinton a rating of 4.8, on a 0 to 100 scale, while the second voter’s ratings were the reverse. See the Appendix for further explanation.
[7] One citation is to a newspaper article by John Sides. What he actually wrote was “During the primary, Michael Tesler and I noted two key features of Trump support: people’s financial anxiety and racial attitudes. This appears entirely consistent with the types of people and places who swung toward Trump on Tuesday” (emphasis added). A second citation is to a newspaper article by Tesler that actually says nothing at all, one way or the other, about whether “economics” made a difference to the outcome of the 2016 election. Another citation is to Mutz (2018; emphasis added), the title of which summarizes her actual thesis: “Status threat, not economic hardship, explains the 2016 presidential vote.” The paper’s opening paragraphs state that “change in financial wellbeing had little impact on candidate preference,” and that the evidence does not support “the ‘left behind’ thesis (that is, the theory that those who lost jobs or experienced stagnant wages due to the loss of manufacturing jobs punished the incumbent party for their economic misfortunes).” Mutz does not contend that “economics” tout court had no bearing on the election outcome. Ferguson et al.’s fourth and final citation is to Sides, Tesler, and Vavreck’s (2018) recent book. What it actually argues is that “the important sentiment underlying Trump’s support was not ‘I might lose my job’ but, in essence, ‘People in my group are losing jobs to that other group.’ Instead of a pure economic anxiety, what mattered was racialized economics” (Sides, Tesler, and Vavreck 2018: 8; emphasis added). This is quite different from the claim that “economics” tout court made little or no difference.
[8] The ANES database contains responses to two different “strong leader” questions, both of which are components of my “favors authoritarian leadership” scale. The Ferguson et al. study does not indicate which question their “needs strong leader” variable refers to, but the lead author kindly clarified in personal correspondence that it is “What our country really needs is a strong, determined leader who will crush evil and take us back to our true path.” The other “strong leader” question is “Having a strong leader in government is good for the United States even if the leader bends the rules to get things done.”
[9] See, for example, (1) the discussion, in my previous article, of Obama-Trump voters’ pronounced economic anxiety despite the absence of evidence that they personally experienced more economic hardship than non-Trump voters; (2) the Gallup polling evidence, cited in that article, that Republican voters’ economic confidence abruptly skyrocketed after Trump’s election while Democratic voters’ economic confidence abruptly plummeted; and (3) additional evidence that “economic anxiety” was derivative of racial and other discontent, presented in Sides, Tesler, and Vavreck’s Identity Crisis and summarized in my review of their book.
[10] My averages give each question equal weight.
[11] In a few cases, the response to the ANES question about the voter’s highest level of education was not a particular grade or degree but “other.” If the respondent then specified that s/he was a high-school graduate, the response was recoded as 0; otherwise it was recoded as 0.5.
[12] The values of the eight income classes were then recoded as 0/7, 1/7, … 6/7, 7/7.
[13] The ANES database contains both pre- and post-election “feeling thermometer” scores. I employed the latter, since they are more likely to capture changes in voters’ feelings between the pre-election survey and election day. However, the post-election Trump feeling score reported for one voter (a black woman who voted for Clinton) was invalid. Her pre- and post-election Clinton feeling scores were identical. I replaced the invalid entry with her pre-election Trump feeling score.
[14] One of the components of this scale is a question about whether it is “better, worse, or makes no difference for the family as a whole if the man works outside the home and the woman takes care of the home and family.” Both the “worse” and the “makes no difference” responses were assigned a value of 0, while the “better” response was assigned a value of 1.
[15] For differing views on this matter, see Pérez & Hetherington (2014) and MacWilliams (2016).

Be the first to comment